Figures & data
Table 1. The details of the search article.
Figure 1. The process of statistical analysis.
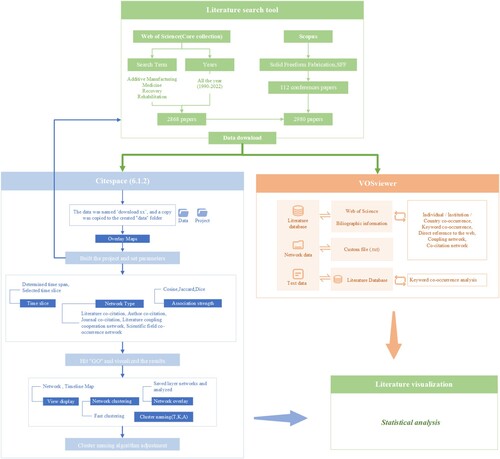
Figure 2. The detailed structure of statistical analysis.
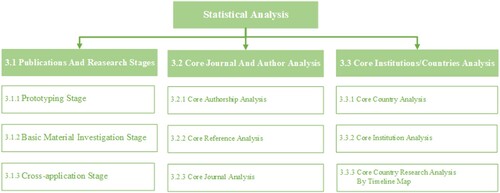
Figure 3. The number of publications in 1990–2022.
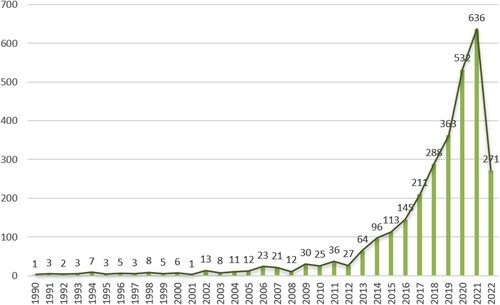
Figure 4. Overlay maps of the scientific literature.
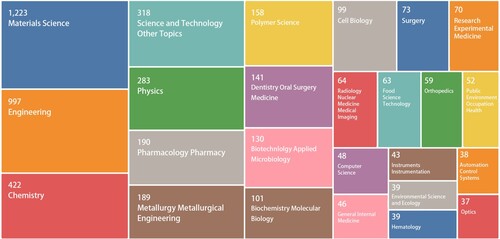
Table 2. Subjects in the overlay maps.
Figure 5. WOS output of the research direction of the map (the number of results retrieved: 25).
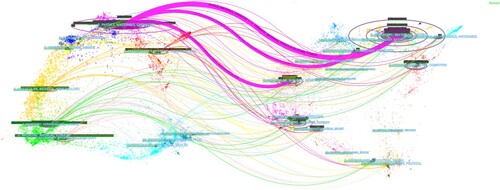
Table 3. Eight major disciplines analyse results of WOS.
Table 4. The top 10 journals by publication.
Table 5. Top 10 cited journals in terms of times of co-citation.
Figure 6. Map of core journals network in AM Technology in RM.
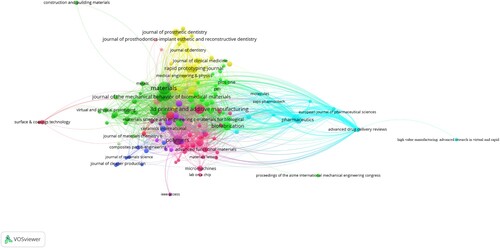
Figure 7. Map of reference network of AM application in RM.
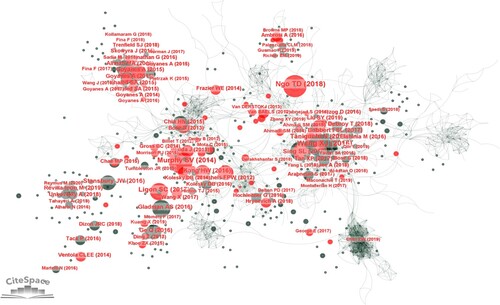
Figure 8. Top 25 references with strongest Citation Bursts.
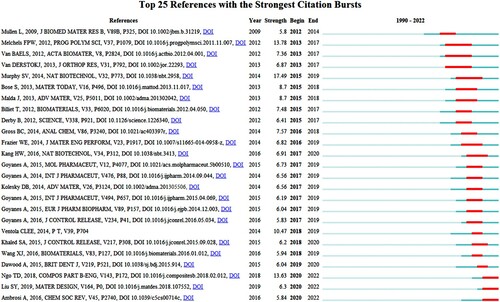
Table 6. Key research points.
Figure 9. Map of co-authorship network.
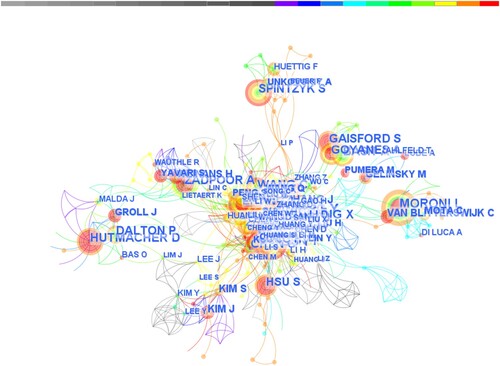
Figure 10. Timelines of co-authorship network.
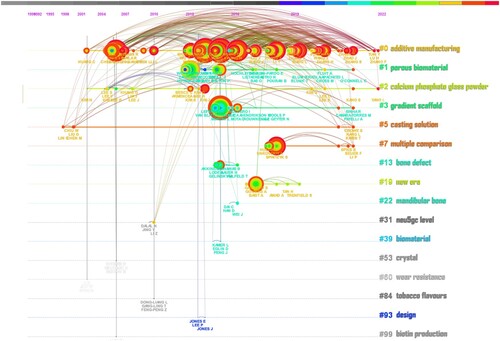
Figure 11. Map of the co-institution network.
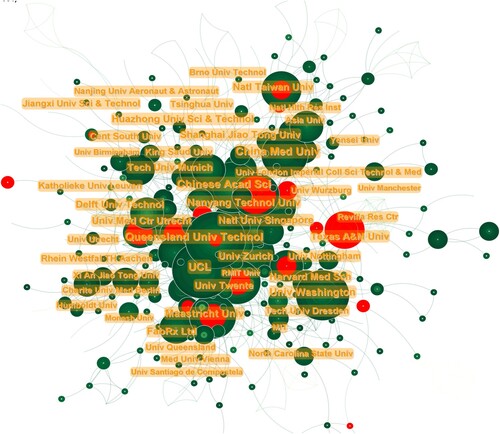
Table 7. Top 10 institutions investigating the application of AM in RM.
Figure 12. Top 4 countries with the strongest Citation Bursts.
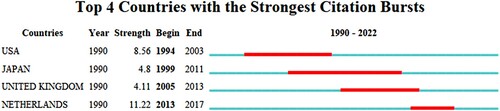
Table 8. Top 10 countries in AM technology in RM.
Figure 13. Timeline map of co-country/region network.
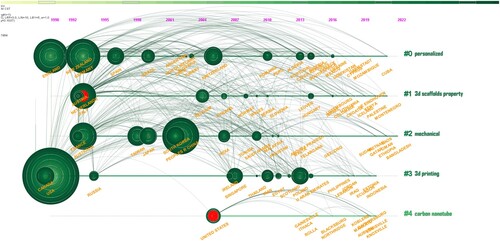
Figure 14. The timeline map for China.
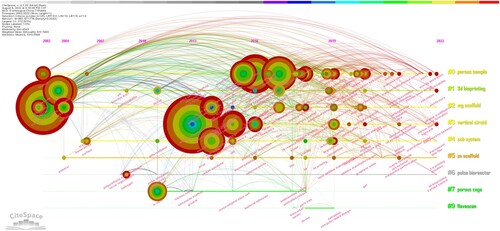
Figure 15. The timeline map for the UK.
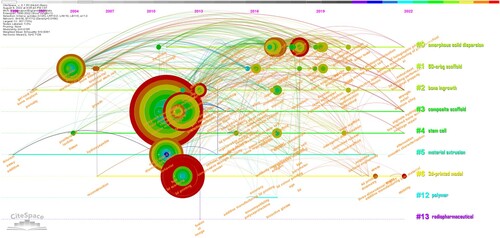
Figure 16. The timeline map for the USA.
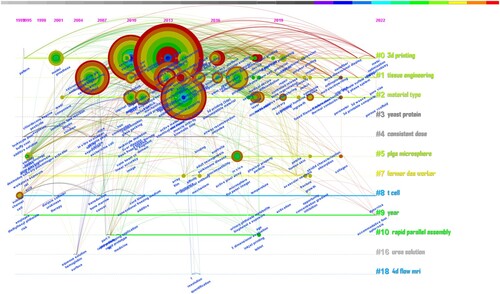
Figure 17. The timeline map for Germany.
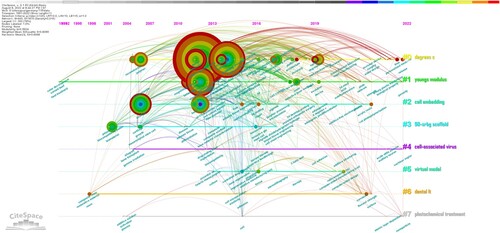
Figure 18. The timeline map for Japan.
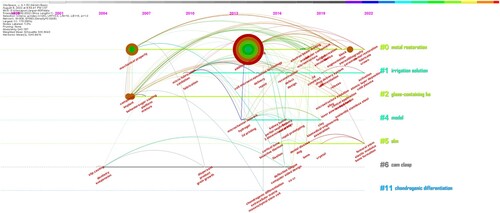
Figure 19. The timeline map for the Netherlands.
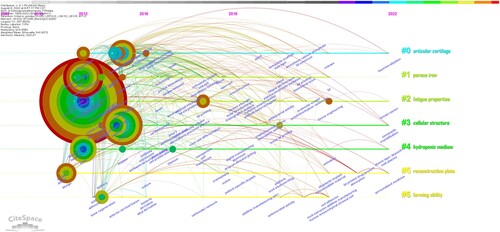
Figure 20. Summary of changes in research directions in six core countries.
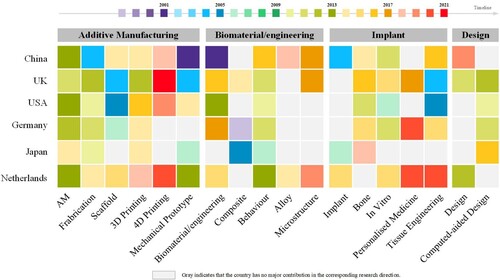
Figure 21. Visual map of keyword co-occurrence.
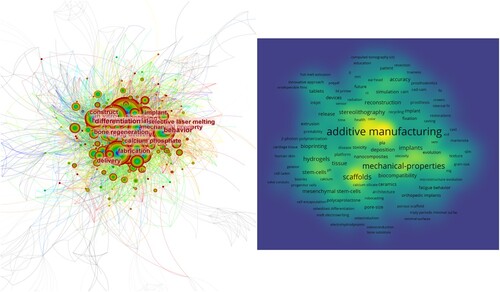
Table 9. Top 10 Keywords in AM technology in RM.
Figure 22. Visual map of keyword clustering.
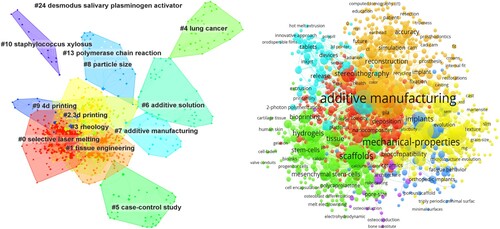
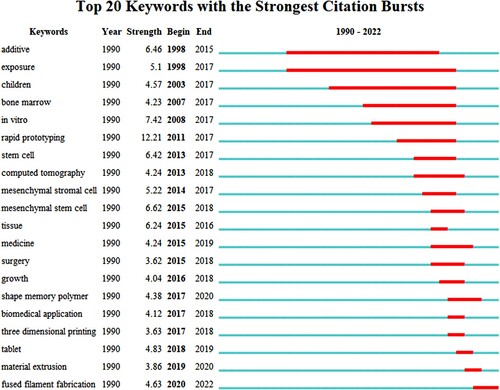
Figure 23. Top 20 keywords with the strongest citation bursts.