
Figures & data
Figure 1. (a) x-z plane, (b) y-z plane and (c) x-y plane of the in-situ alloyed TiTa lattice sample; (d), (e) and (f) show the corresponding planes of the representative CAD models.
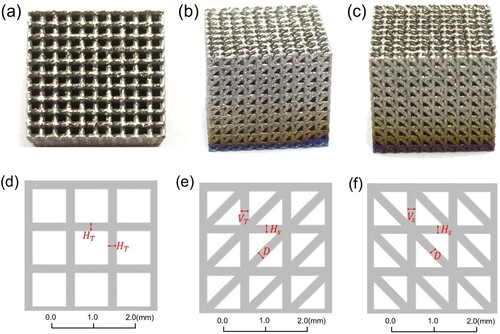
Figure 2. CAD model of the designed unit cell.
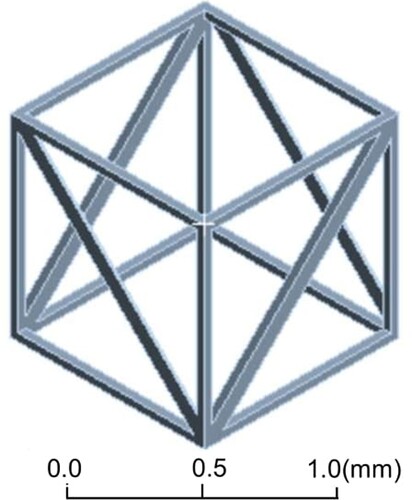
Figure 3. Strut thickness of the selected lattice samples.
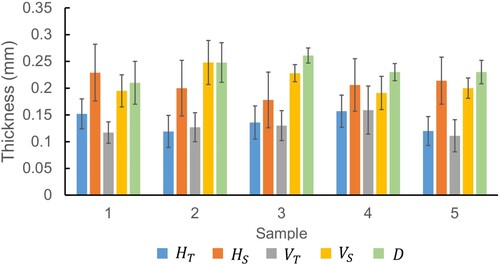
Table 1. Processing parameters of the selected lattice samples.
Table 2. Nominal material properties of in-situ alloyed TiTa.
Figure 4. (a) and (b) show the CAD model and boundary conditions for beam finite element simulation model. (c) and (d) show the CAD model and boundary conditions for full-3D finite element simulation model.
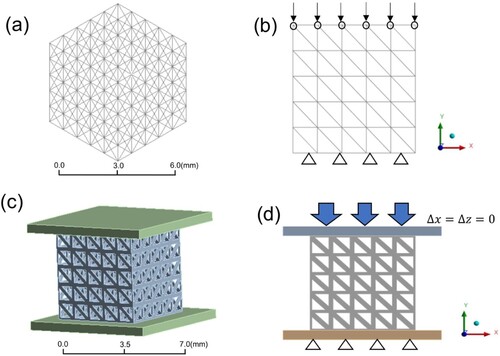
Figure 5. Comparison of actual porosity to the simulation porosity.
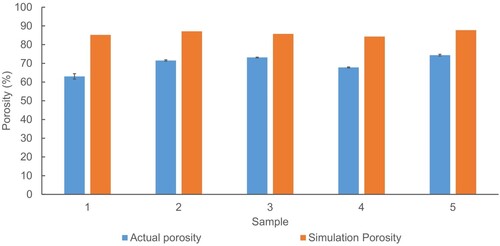
Figure 6. (a) and (b) illustrate the deformation of lattice structure simulated using the beam model and full-3D model respectively. (c) shows the corresponding von-Mises stress for the full-3D model.
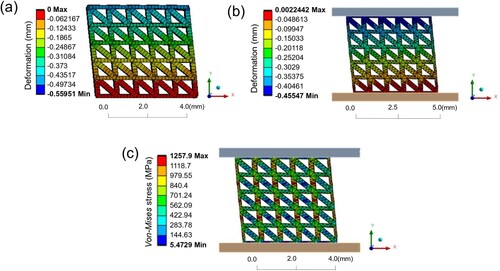
Figure 7. A typical stress-strain curve from the finite element simulation with the bilinear elastic-plastic material model.
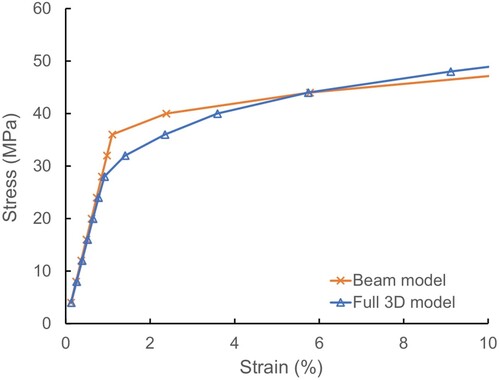
Figure 8. Comparison of the (a) elastic modulus and (b) yield strength of the experimental data to the FEA results of beam model and full-3D models.
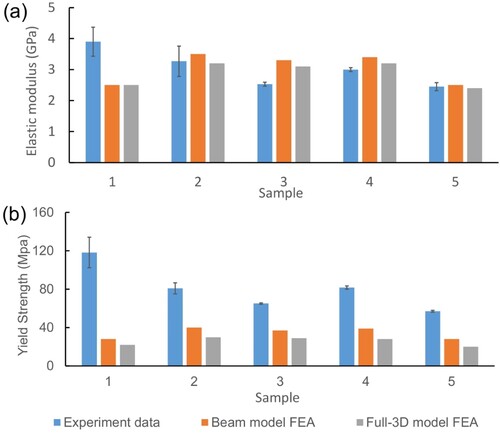
Figure 9. (a) Elastic modulus and (b) yield strength fitted with the Gibson-Ashby model.
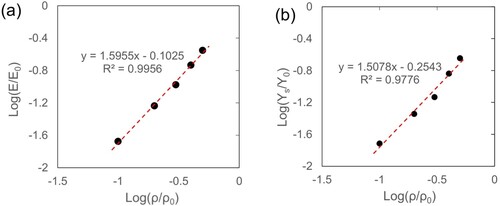
Table 3. Strut thickness and mechanical properties obtained from the full-3D model for uniform lattice structures with different porosity.