
Figures & data
Table 1. Correspondence table of experimental codes and factors.
Figure 1. Schematic diagram: (a) the solution and ageing HT, (b) the equilibrium solidification phase diagram of the Ni-based superalloy, (c) geometric schematic of as-fabricated tensile and cubic specimens, (d) dimensions of the tensile specimens and (e) the used scanning strategy.
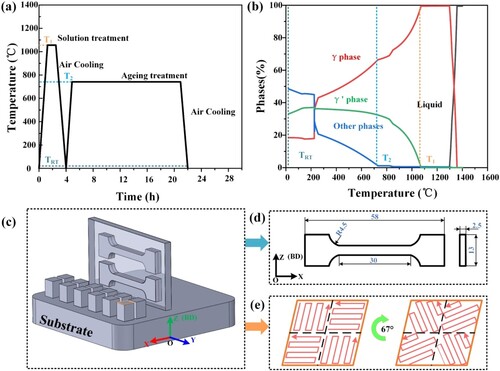
Figure 2. 3D response surface graphs showing the optimal region of the solidification crack index (SCI) in terms of elements combinations: (a) Al and Ti, (b) Ti and Nb, (c) Al and Nb, (d) Ti and Ta, (e) Al and Ta and (f) Nb and Ta.
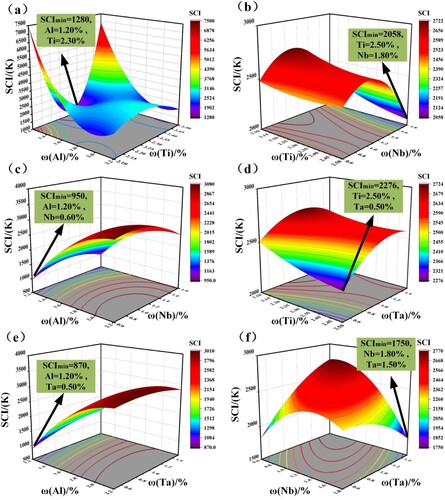
Figure 3. 3D response surface graphs showing the optimal region of the freezing range (FR) in terms of element combinations: (a) Al and Ti, (b) Ti and Nb, (c) Al and Nb, (d) Ti and Ta, (e) Al and Ta and (f) Nb and Ta.
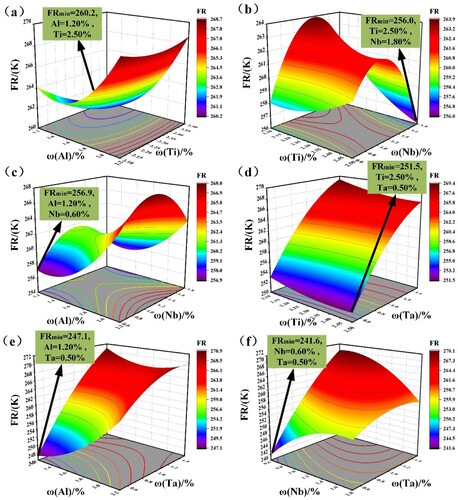
Table 2. Designed composition and chemical composition of SD01 powder (wt.%).
Figure 4. Surface morphology of powders: (a) for SD01 powder, (b) for TiB2 powder, (c) and (d) for SD01-C. The mixture process is shown in (e). X-ray diffraction (XRD) results of the powder specimens: (f) 30°–100° scan pattern and (g) 43°–45° local scan pattern.
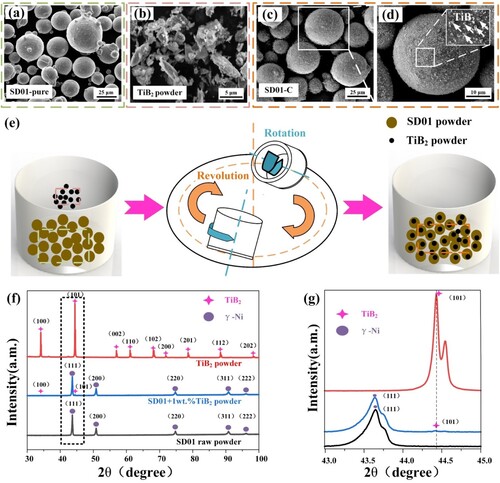
Figure 5. Scheil solidification curves of various alloys using Thermo-Calc with the TCNI9 database: (a) over the full range of solid fraction and (b) in the range of 0.9–0.99, (c) and (d) are the SCI values calculated based on (a) and (b), and (e) and (f) are the γ and γ’ volume fractions versus temperature, respectively.
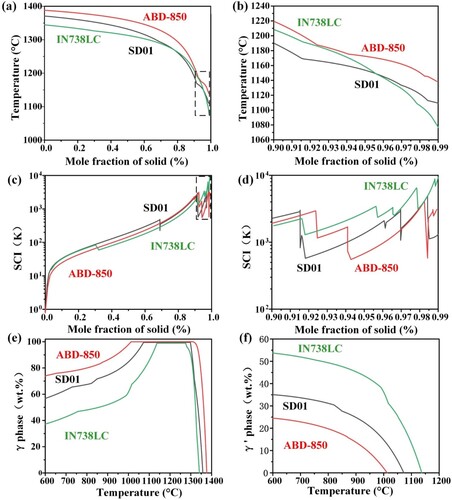
Figure 6. Scanning electron microscope (SEM) microstructure and energy dispersive spectrometry (EDS) analysis of the SD01 and SD01-C. (a)–(b) and (d)–(e) are the SEM morphologies of the specimens under different magnifications, (c) and (f) show the EDS analysis of the matrix and the particles from the SD01 and SD01-C specimens.
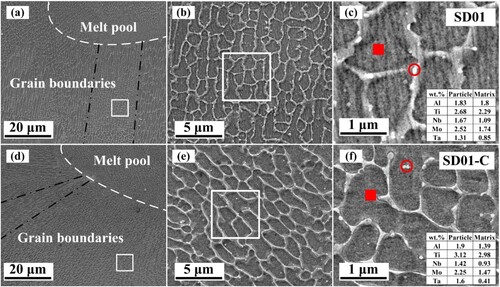
Figure 7. Inverse pole figure (IPF) maps of (a) SD01 and (d) SD01-C, pole figure (PF) maps of (b) SD01 and (e) SD01-C, and (c) and (f) grain boundary map. Red lines represent low-angle grain boundaries (LAGBs, 5°−15°), while blue lines are high-angle grain boundaries (HAGBs, > 15°) in (c) and (f). (g) Grain aspect ratio distribution of SD01 and SD01-C. Grain boundary length density as a function of misorientation angle of (h) SD01 and (i) SD01-C.
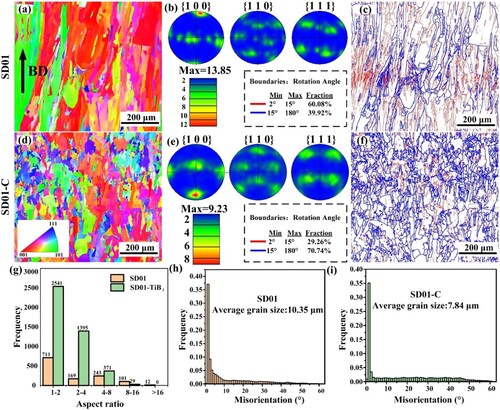
Figure 8. SEM microstructure, EDS analysis and EBSD analysis of the SD01 and SD01-C after HT. (a)–(d) SEM morphologies of the specimens at different magnifications; (e) EDS analysis of the matrix and the precipitation of SD01 and SD01-C; (g) and (h) the inverse pole figure (IPF) maps of SD01 and SD01-C; (f) and (i) the grain boundary map of SD01 and SD01-C.
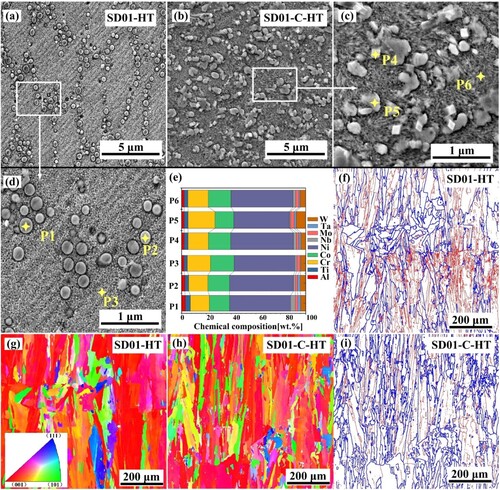
Figure 9. Kernel average misorientation (KAM) maps and calculation of: (a) SD01-AB; (b) SD01-HT; (c) SD01-C-AB; (d) SD01-C-HT.
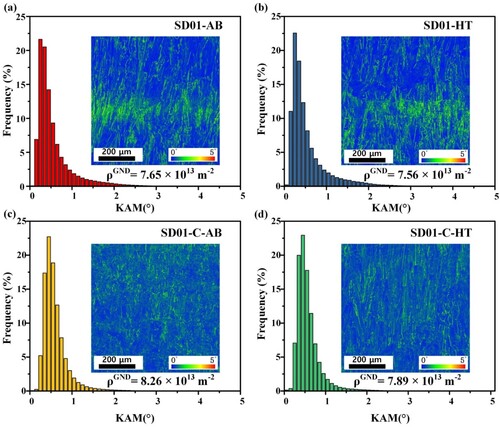
Figure 10. Engineering stress-strain curves of the as-fabricated and heat-treated original and SD01-C: (a) at room temperature, (b) at 900°C, and (c) at 1,000°C; (d) a summary of the ultimate tensile strength (UTS) versus elongation at room temperature and at 900°C between the designed materials in this study and the literature (Chen et al. Citation2020; Chen et al. Citation2022; Marchese et al. Citation2018; Sun et al. Citation2021; Tang et al. Citation2020; Wang et al. Citation2012; Yang et al. Citation2021; Zhang et al. Citation2022a; Zhang et al. Citation2022b; Zhou et al. Citation2020).
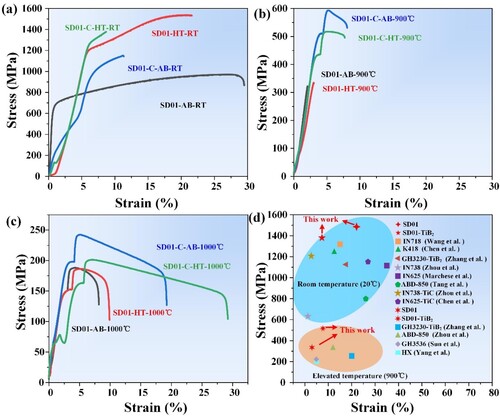
Figure 11. Fracture morphologies of the heat treated SD01 alloy: (a) at room temperature, (b) at 900°C and (c) at 1,000°C.
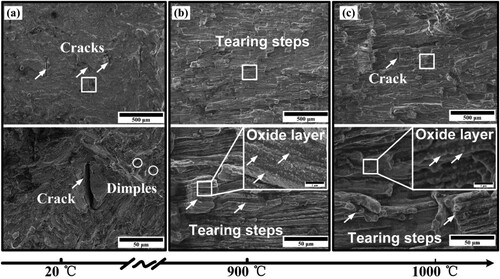
Figure 12. Fracture morphologies of heat-treated SD01-C: (a) at room temperature, (b) at 900°C and (c) at 1000°C.
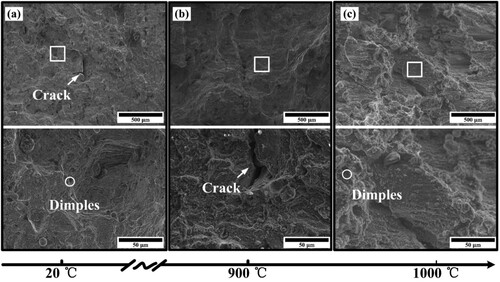
Figure 13. Schematic diagram of the precipitation behaviour of SD01 and SD01-C at different conditions: (a) as-fabricated SD01; (b) SD01 after HT, (c) as-fabricated SD01-C and (d) SD01-C after HT.
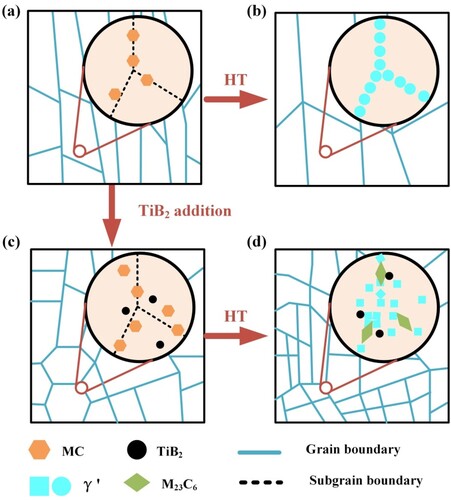
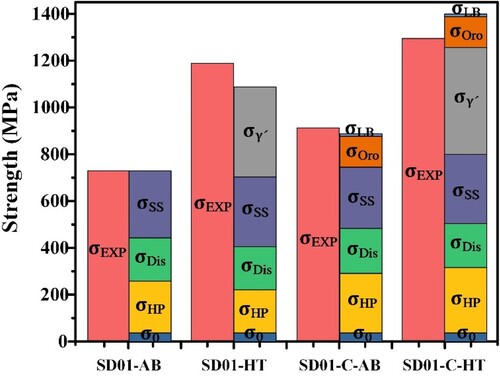
Figure 14. The calculated and experimentally obtained strengthening contributions of the SD01-AB and SD01-C before and after HT.
Data availability
Data will be made available on request.