Figures & data
Table 1. Compositions used for the Csf/SiC slurries.
Figure 1. Fabrication of Csf/SiC CMC preform by material extrusion based additive manufacturing.
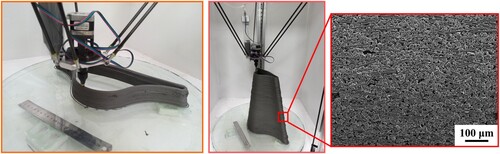
Figure 2. (a) Log viscosity versus log shear rate plots; (b) log shear stress versus log shear rate of varying Csf/SiC slurries with different solid loading.
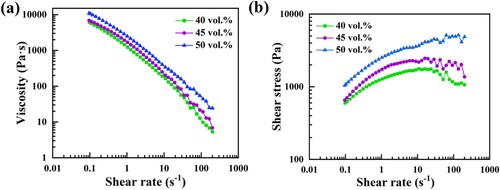
Figure 3. (a) Cross-section images of filament under varying solid loading and nozzle diameter; (b) outlines and areas of filament cross-sections under varying solid loading and nozzle diameters (simulated by ImageJ).
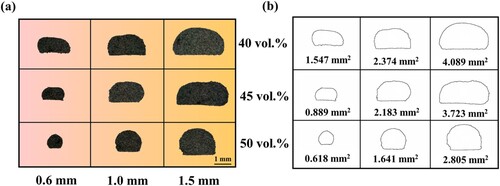
Figure 4. The schematic of the measured line width of filaments.
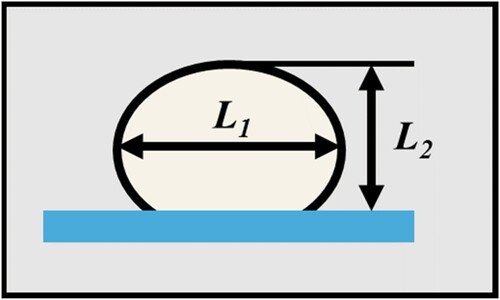
Table 2. The measured line width (mm) of filaments under varying solid loading and nozzle diameter.
Figure 5. Images of specimens with single filament plus multi-layer structure under varying solid loading: (a) 40 vol.%; (b) 45 vol.% and (c) 50 vol.%. (nozzle diameter: 1.0 mm; layer height: 0.75 mm).
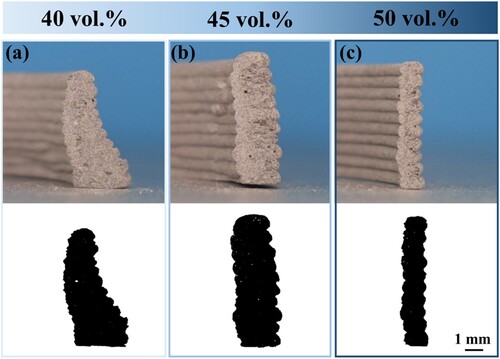
Figure 6. The height deviation of specimens with single filament plus multi-layer structure under varying solid loading.
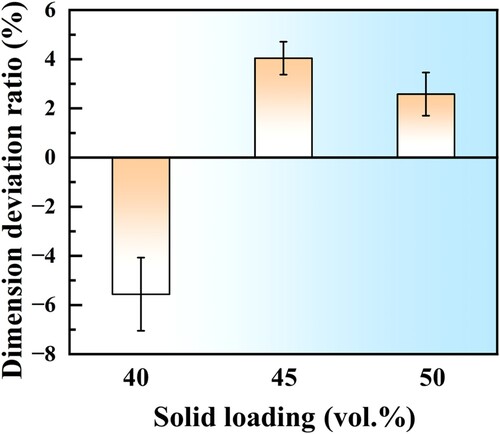
Figure 7. Images of 50-Csf/SiC specimens with two filaments plus multi-layer structure under varying nozzle diameter: (a) 0.6 mm; (b) 1.0 mm; and (c) 1.5 mm. (solid loading: 50 vol.%; layer height:75% of nozzle diameter).
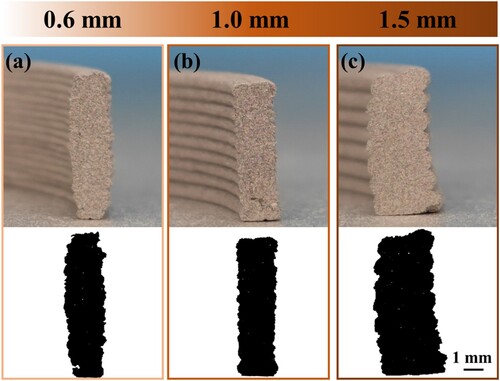
Figure 8. The height deviation of specimens with two filaments plus multi-layer structure under varying nozzle diameter.
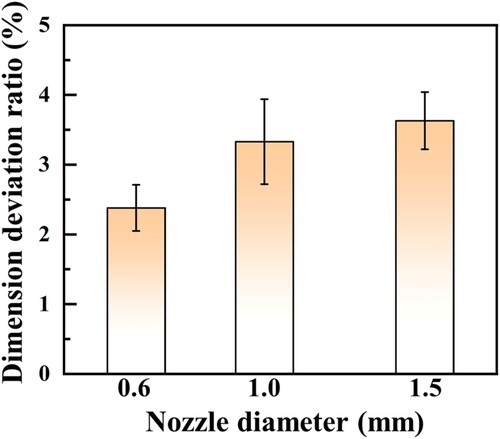
Figure 9. Images of 50-Csf/SiC specimens with two filaments plus multi-layer structure under varying layer height: (a) 45%; (b) 60%; (c) 75%; and (c) 90% of the nozzle diameter (1.0 mm).
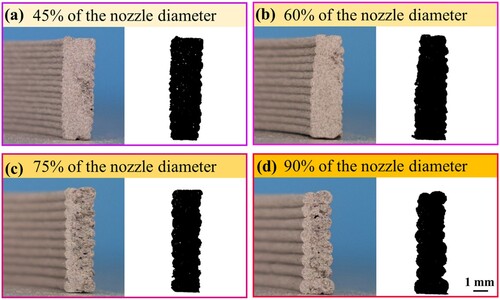
Figure 10. The height deviation of specimens with two filaments plus multi-layer structure under varying layer height.
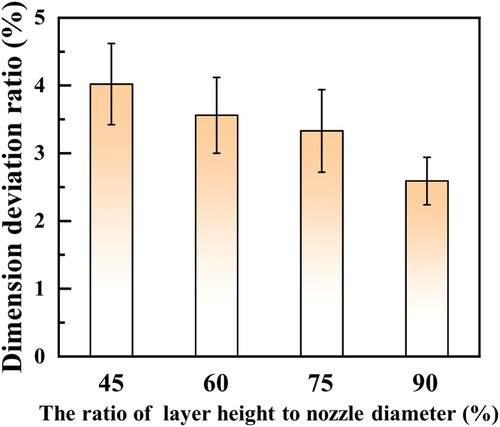
Figure 11. (a) Schematic illustrations of extrusion process under various layer height and (b) schematic illustrations of the deposition of filament.
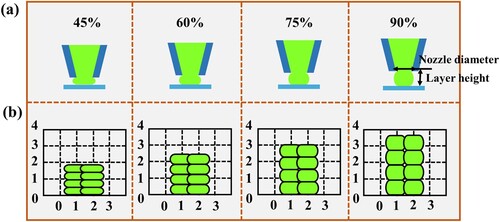
Figure 12. (a) The idealised wall; the printed walls with different angles from the vertical: (b) 10o; (c) 20o; (d) 30o; (e) 40o; (f) 45o. The top layer interface was marked in black. (solid loading: 50 vol.%; nozzle diameter: 1.0 mm; layer height: 0.75 mm).
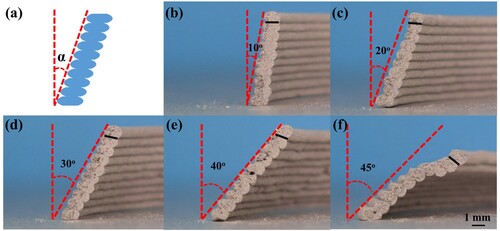
Table 3. The α of idealised structure and the α of printed structure.
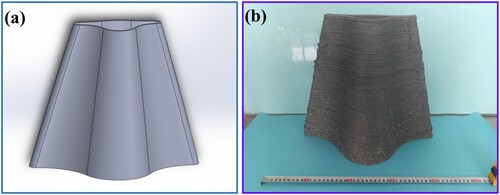
Figure 13. Images of large-scale Csf/SiC CMC preform with out of plane structure.