
Figures & data
Table 1. Abbreviation for the different samples.
Figure 1. (a) 3D printed sample for TGA and mechanical analysis; (b) Top view of the printing path to differentiate the front and rear half of the sample; Schematic diagram for the print path with dimensions for (c) TGA and compressive strength test and (d) flexural strength test.
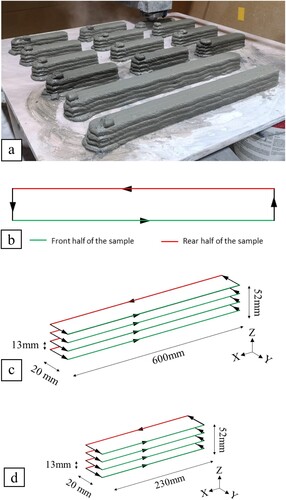
Figure 2. Schematic diagram on the side view of printing with concrete and CO2 jetting nozzle for the (a) front half of the sample (b) rear half of the sample.
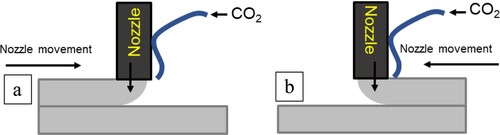
Figure 3. Schematic side view diagram of CJET printing method.
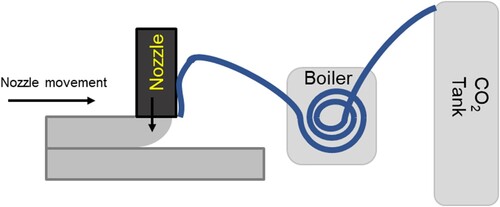
Figure 4. Schematic diagram on the side view of printing with concrete and CO2 jetting with steam for the (a) front half of the sample (b) rear half of the sample.
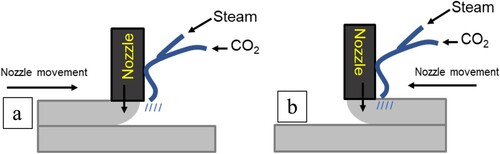
Figure 5. Alternative approach for TGA sample preparation; (a) Sliced sample; (b) Sliced sample pulverised into fine powders.
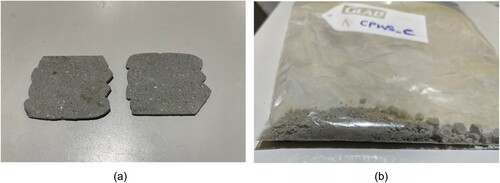
Figure 6. Schematic drawing of the sample cross-section for all carbon cured samples. The green lines represent the where the CO2 was jetted during printing. The red circle represents where the sampling was taken for TGA test.
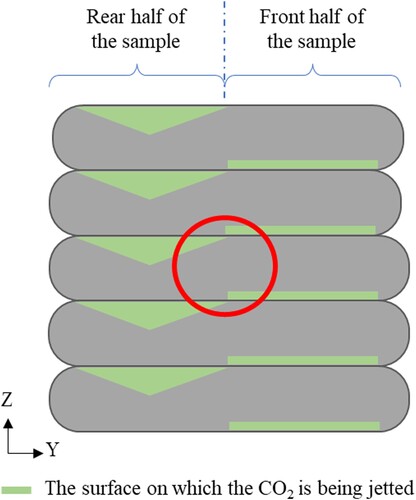
Figure 7. (a) Percentage of mass loss by weight of sample from 520°C to 950°C for samples 3D printed using various carbon jetting methods. (b) Percentage of mass loss by weight of sample from 520°C to 720°C and 720°C to 950°C for samples 3D printed using various carbon jetting methods.
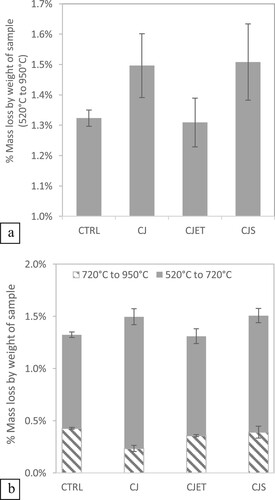
Figure 8. Thermogravimetric analysis (TGA) and derivative thermogravimetry (DTG) result of the samples with different printing parameters; (a) combined results for comparison between TGA and DTG; (b) Thermogravimetric analysis (TGA) result; (c) derivative thermogravimetry (DTG) result; (d) zoomed in derivative thermogravimetry (DTG) result for temperature between 520°C and 950°C.
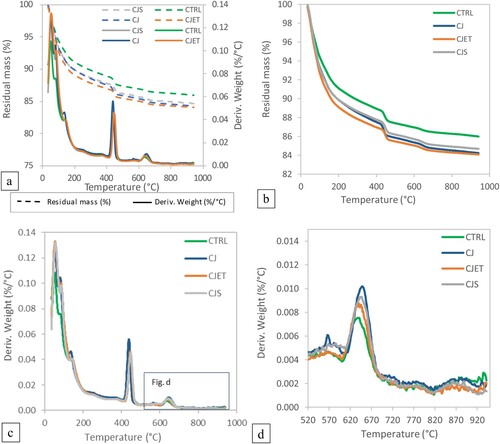
Figure 9. Flexural strength of control samples, CO2 jetting (CJ) sample, CO2 jetting at elevated temperature (CJET) samples and CO2 with steam printing (CJS) samples.
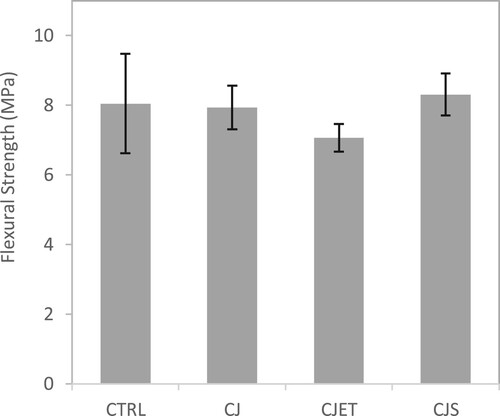
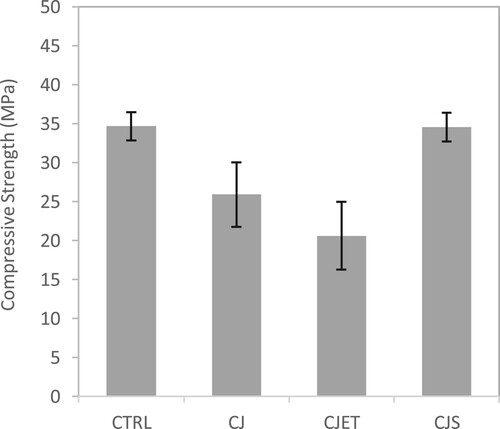
Figure 10. Compressive strength of control samples, CO2 jetting (CJ) sample, CO2 jetting at elevated temperature (CJET) samples and CO2 with steam printing (CJS) samples.
Data availability statement
The authors confirm that the data supporting the findings of this study are available within the article.