
Figures & data
Figure 1. Examples of FRD lattice structures: (a) uniform lattice; and (b) graded lattice.
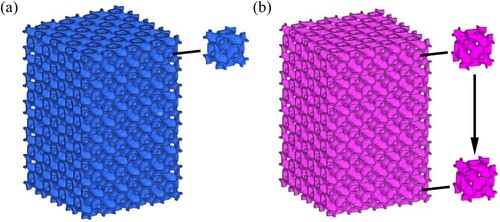
Figure 2. Numerical set-up of the FRD lattice under crushing loadings: (a) the established FE model and (b) mesh size.
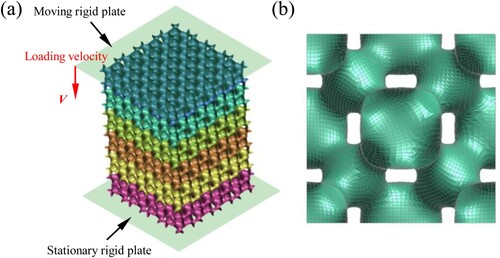
Table 1. The mechanical properties of EOS CX stainless steel [Citation8].
Figure 3. Comparisons between the numerical simulation and experimental results [Citation8]: (a) deformation mode evolution; and (b) force-displacement curve.
![Figure 3. Comparisons between the numerical simulation and experimental results [Citation8]: (a) deformation mode evolution; and (b) force-displacement curve.](/cms/asset/70bb9d23-1930-4f26-bebc-3ceca62fcaaf/nvpp_a_2283027_f0003_oc.jpg)
Figure 4. (a) Drop-tower testing system; and (b) Compassions of force-displacement curve between the simulation and experiment.
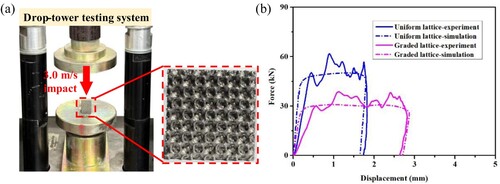
Figure 5. (a) the numerical stress-strain curves and (b) the plateau stress and densification strain varying with the relative density.
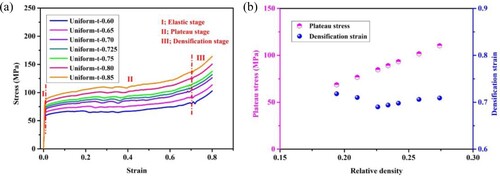
Figure 6. The effect of lattice gradation on the stress-strain responses: (a) two-layer graded configurations and (b) three-layer graded configurations.
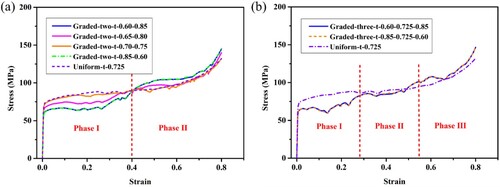
Figure 7. Stress-strain responses of six-layer graded lattice structures.
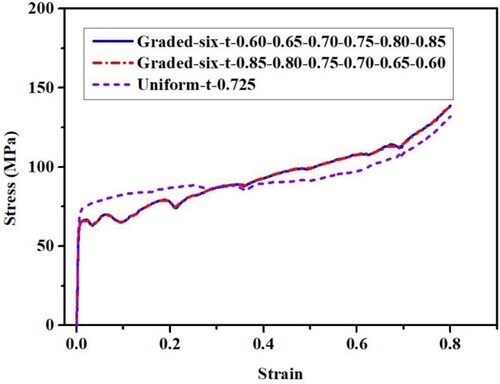
Figure 8. Deformation evolutions of uniform and graded lattice structures under quasi-static compression: (a) ‘Uniform-t-0.725’; (b) ‘Graded-two-t-0.60-0.85’; (c) ‘Graded-three-t-0.85-0.725-0.60’; and (d) ‘Graded-six-t-0.60-0.65-0.70-0.75-0.80-0.85’.
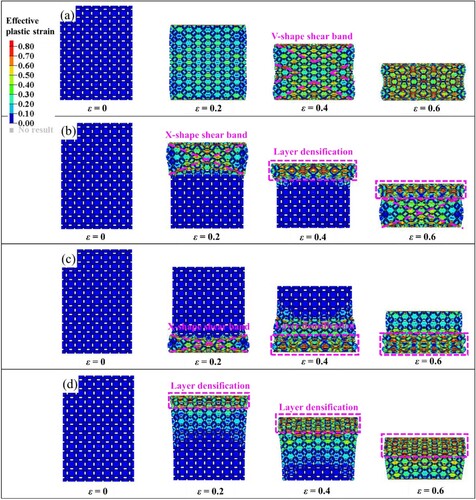
Figure 9. Energy absorption characteristics of uniform FRD lattices under quasi-static compression: (a) curves; and (b)
.
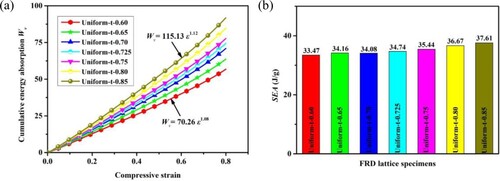
Figure 10. Comparisons of uniform and graded FRD lattices under quasi-static compression: (a) curves; and (b) energy absorption capacity (
).
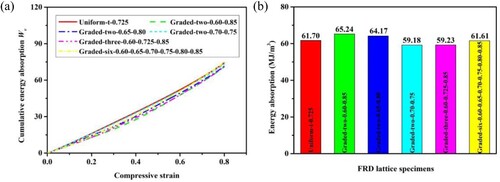
Figure 11. The nominal stress-strain data of the uniform lattice specimens fitted by the R-PH idealisation model.
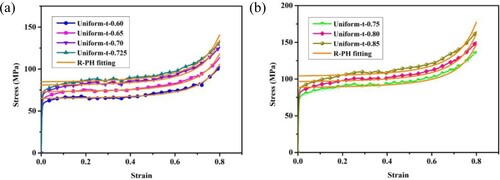
Figure 12. and
varying with the relative density of lattice structures. Note that the fitted power-law equations are also plotted here.
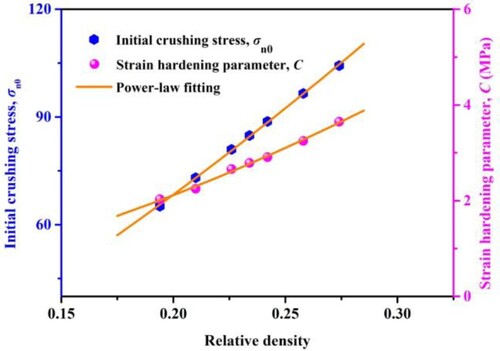
Figure 13. 3D spatial deformation distributions for lattice specimen ‘Uniform-t-0.75’ at three different loading velocities: (a) 1.8 m/s; (b) 135 m/s; and (c) 225 m/s. Note that the compressive strain is 0.20 here.
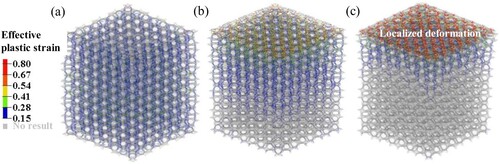
Figure 14. 3D spatial deformation distributions for lattice specimen ‘Graded-six-t-0.85-0.80-0.75-0.70-0.65-0.60’ at three different loading velocities: (a) 1.8 m/s; (b) 135 m/s; and (c) 225 m/s. Note the compressive nominal strain is 0.20 here.
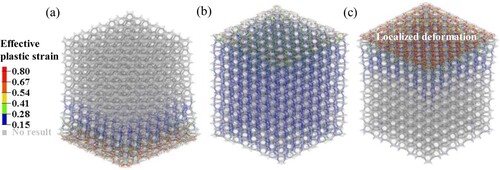
Figure 15. Stress-strain curves of lattice specimen ‘Uniform-t-0.75’ at different strain-rates for two cases: (a) extracted at impact end and (b) extracted at support end.
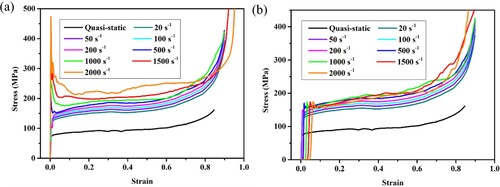
Figure 16. Stress-strain curves of lattice specimen ‘Graded-six-t-0.60-0.65-0.70-0.75-0.80-0.85’ at different strain-rates for two cases: (a) extracted at impact end and (b) extracted at support end.
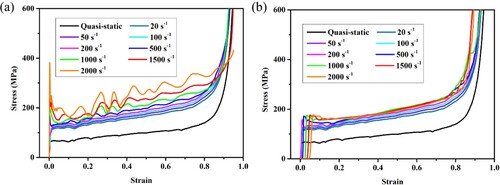
Figure 17. The plateau stress and densification strain varying with the nominal strain-rates: (a) ‘Uniform-t-0.75’; and (b) ‘Graded-six-t-0.60-0.65-0.70-0.75-0.80-0.85’.
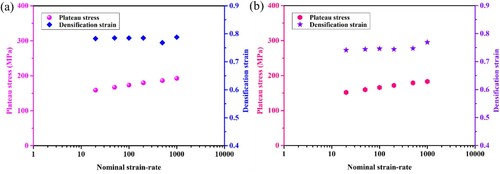
Figure 18. Stress uniformity coefficient varying with the crushing velocity: (a) ‘Uniform-t-0.75’; and (b) ‘Graded-six-t-0.60-0.65-0.70-0.75-0.80-0.85’.
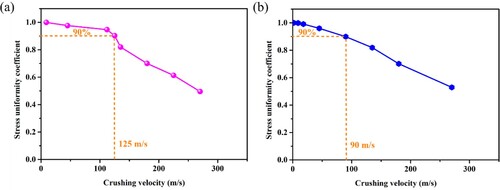
Figure 19. The dynamic stress-stain responses (a) and energy absorption (b) of uniform and graded lattice specimens under the crushing velocity of 45 m/s.
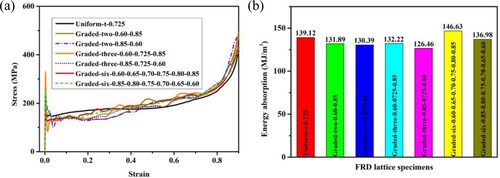
Figure 20. The dynamic stress-stain responses of uniform and graded lattice specimens under the crushing velocity of 270 m/s: (a) impact end; and (b) support end.
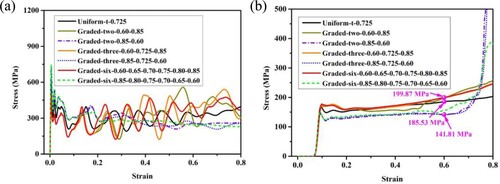
Figure 21. The energy absorption capacity versus compressive strain for the uniform and graded lattice specimens.
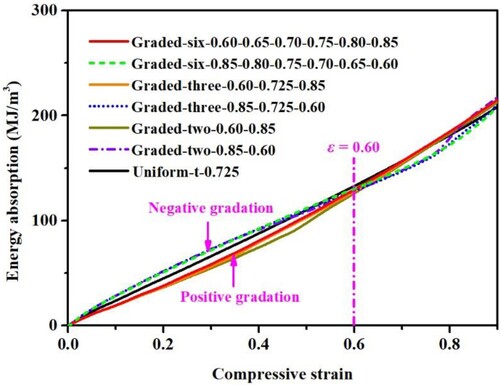
Figure 22. Strain-rate sensitivity of the plateau stress for the lattice ‘Uniform-t-0.75’ with/without base rate-dependence in comparison with the lattice base rate-dependence itself.
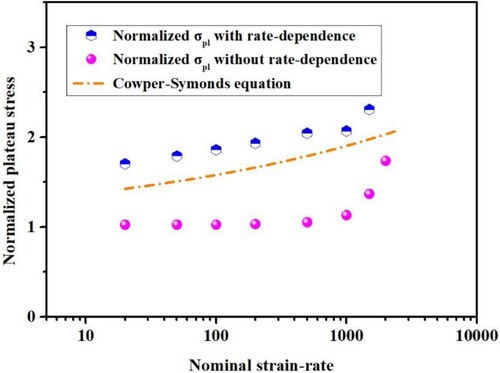
Figure 23. Compressive stress-strain curves of lattice specimen ‘Uniform-t-0.75’ under the loading velocity of 180 m/s.
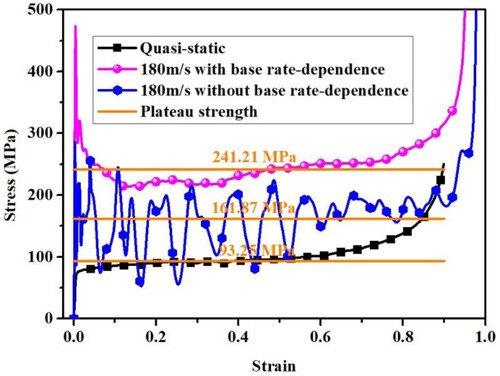
Figure 24. Shock wave model with the basic material parameters.
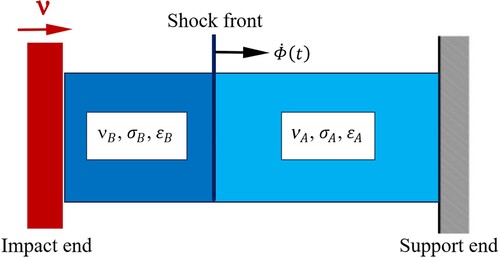
Figure 25. Stress-strain curves of lattice specimen ‘Uniform-t-0.75’ under three different crushing velocities of 180, 225 and 270 m/s for two cases: (a) extracted at impact end and (b) extracted at support end.
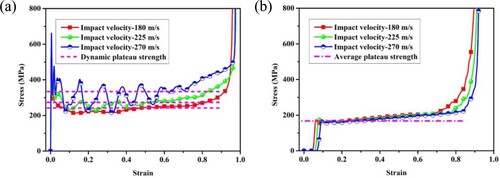
Figure 26. Constitutive model characterization of the lattice specimen ‘Uniform-t-0.75’: (a) stress-strain curves fitted by the R-PH and D-R-PH model; and (b) the normalised material parameters varying with the investigated strain-rate.
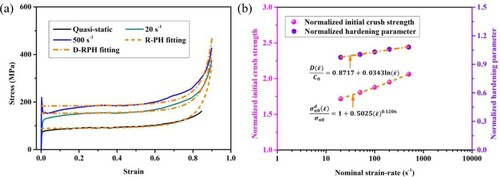
Figure 27. Constitutive model characterization of the lattice specimen ‘Graded-six-t-0.60-0.65-0.70-0.75-0.80-0.85’: (a) stress-strain curves fitted by the D-R-LPH model; and (b) the normalised material parameters varying with the investigated strain-rate.
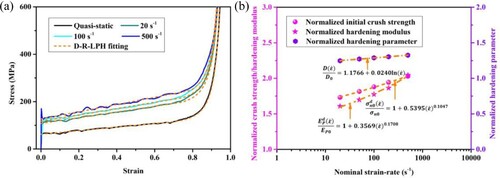
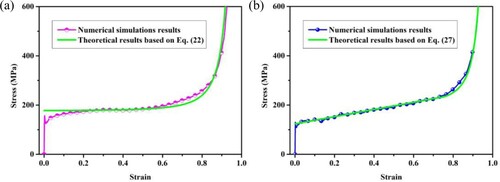
Figure 28. Comparisons of the theoretical and numerical results under the crushing velocity of 27 m/s: (a) ‘Uniform-t-0.75’; and (b) ‘Graded-six-t-0.60-0.65-0.70-0.75-0.80-0.85’.
Data availability statement
Data available on request from the authors.