
Figures & data
Table 1. Chemical composition of the Inconel 718 powder (wt.%).
Figure 1. The schematic diagram of laser hybrid manufacturing process (a) laser direct energy deposition process, (b) laser material removal process, and (c) hybrid laser polishing process.
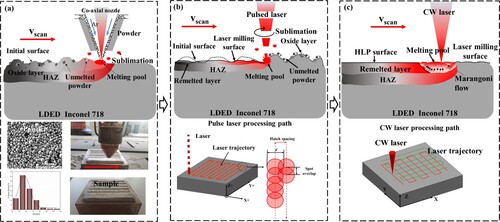
Table 2. Optimised parameters of the hybrid laser polishing.
Figure 2. The geometry of tested specimens for (a) high-temperature tensile test, (b) high-temperature wear specimen and (c) cyclic hot corrosion.
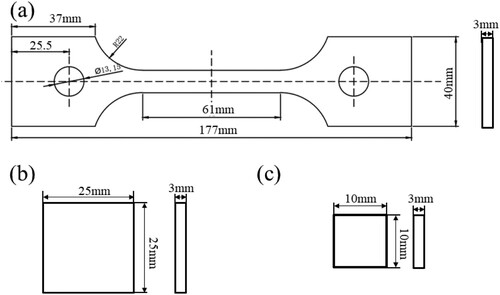
Figure 3. 3D topographic image and SEM morphology of (a,d) as-fabricated, (b,e) laser material removal and (c,f) hybrid laser polishing samples.
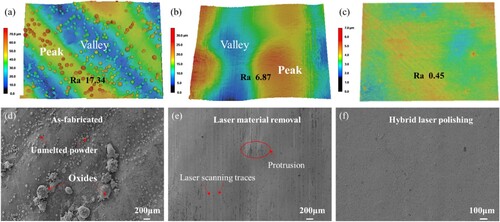
Figure 4. SEM micrographs and EDS mapping of the cross-section of Inconel 718 alloy subjected to different processes: (a,b) as-fabricated, (c,d) laser material removal, (e,f) hybrid laser polishing.
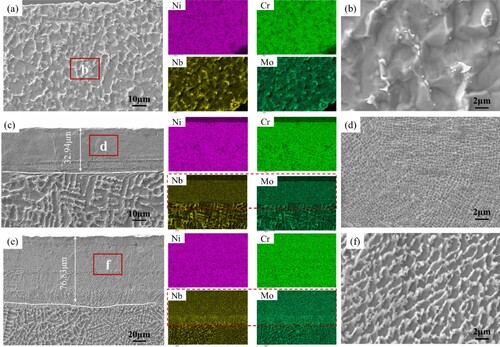
Figure 5. Back-scattering electron images of Inconel 718 alloy subjected to different processes: (a,b) as-fabricated, (c,d) laser material removal, (e,f) hybrid laser polishing.
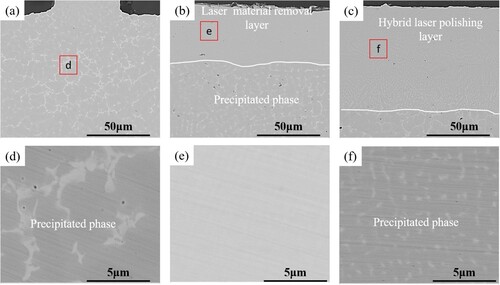
Figure 6. Bright-field TEM micrograph of Inconel 718 alloy subjected to different processes: (a,b) as-fabricated, (c,d) laser material removal, (e,f) hybrid laser polishing.
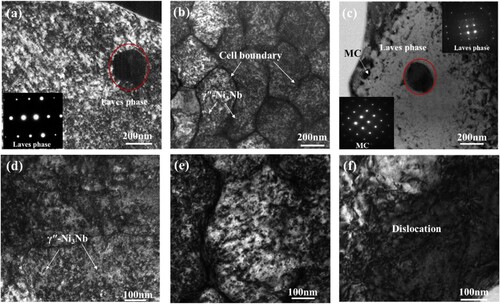
Figure 7. EBSD crystallographic orientation map of (a) As-fabricated, (b) laser material removal and (c) hybrid laser polishing samples; Low angle grain boundaries distribution maps of (d) As-fabricated, (e) laser material removal and (f) hybrid laser polishing samples; Maps of orientation deviation angle (g) As-fabricated, (h) laser material removal and (i) hybrid laser polishing samples.
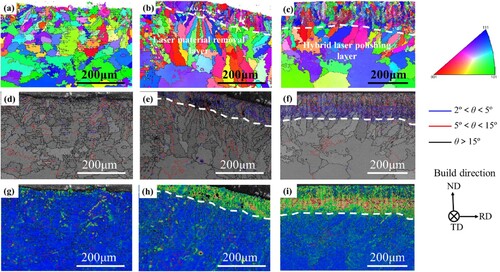
Figure 8. (a) Hot tensile curves of the LDED Inconel 718 specimens before and after the hybrid laser, (b) Triple tensile strength of as-fabricated, laser material removal and hybrid laser polishing samples.
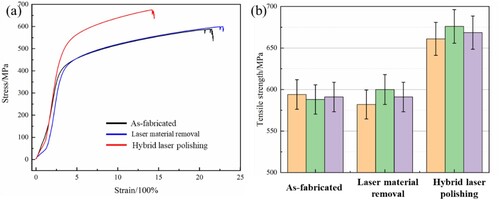
Figure 9. (a) Tensile failure sample morphology at high temperatures; Surface morphology near the tensile fracture (b,e) as-fabricated, (c,f) laser material removal and (d,g) hybrid laser polishing samples.
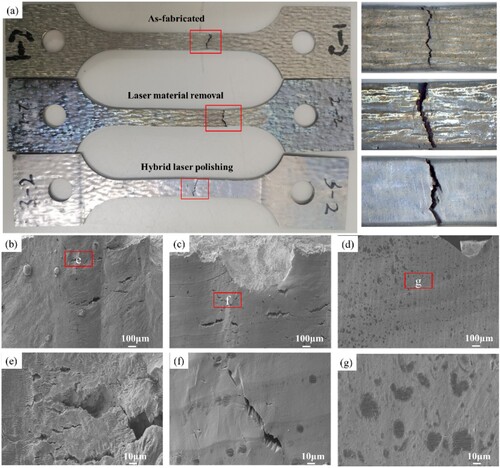
Figure 10. The high temperature tensile fracture surfaces and EDS mapping profiles of Inconel 718 samples: (a,b) as-fabricated, (c,d) laser material removal and (e,f) hybrid laser polishing.
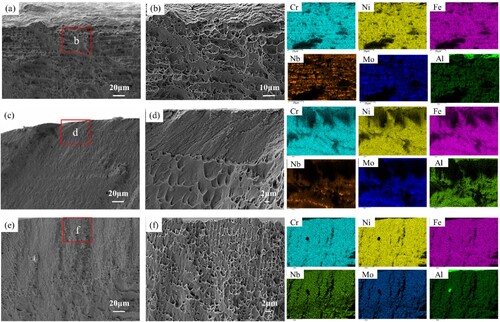
Figure 11. (a) The coefficient of friction of the samples before and after laser polishing at 650°C, (b) cross section profile of wear tracks of the as-fabricated, laser material removal and hybrid laser polishing (Inset image showing the wear rate of the samples before and after laser polishing at 650°C).
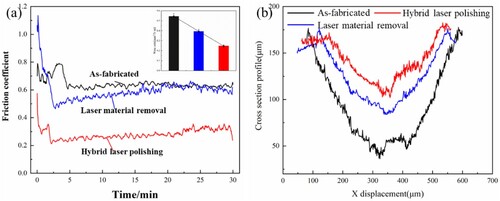
Figure 12. SEM images of worn-out surfaces of (a,b) as-fabricated, (c,d) laser material removal and (e,f) hybrid laser polishing samples at 650°C.
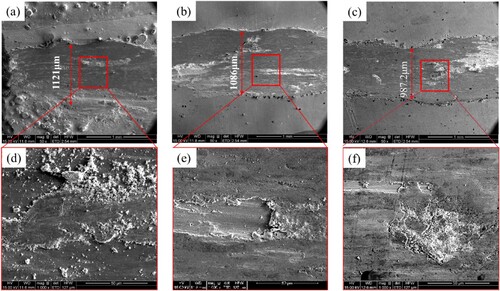
Figure 13. (a) Weight changes of Inconel 718 specimens due to hot corrosion at 650°C as a function of time, (b) Photographical surface of the Inconel 718 after hot corroded at 650°C for 100 h.
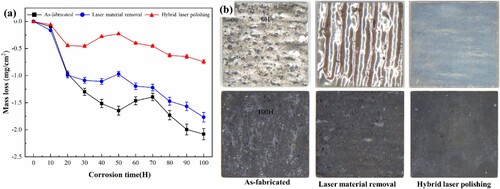
Figure 14. XRD diffraction patterns of Inconel 718 specimens hot-corroded at 650°C for 100 h.
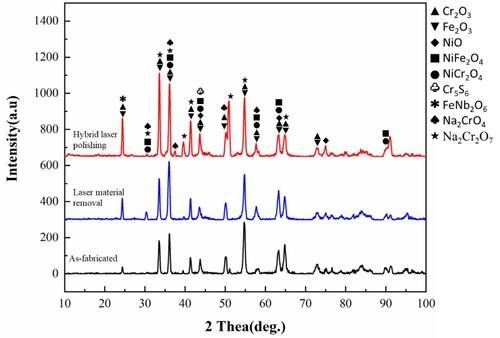
Figure 15. Surface morphology of hot corroded Inconel 718 specimens at 650°C for 100 h: (a,b) as-fabricated, (c,d) laser material removal and (e,f) hybrid laser polishing samples.
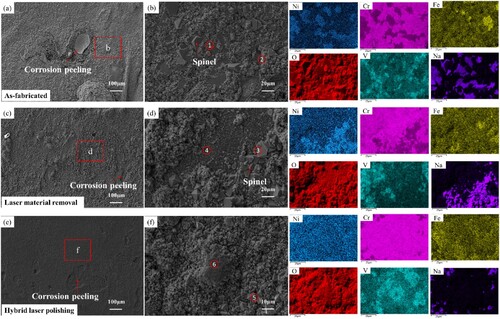
Table 3. The EDS analysis on the surface oxide scales of hot corroded samples (wt.%).
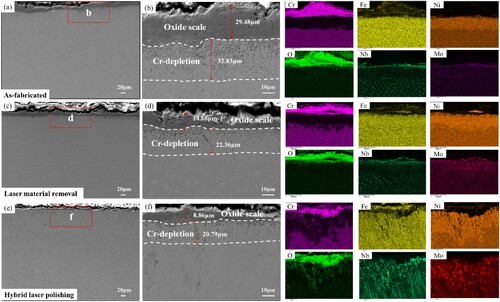
Figure 16. EDS mapping profiles in cross-section of hot corroded Inconel 718 alloy: (a–b) as-fabricated, (c–d) laser material removal samples, (e–f) hybrid laser polishing samples.
Data availability statement
The data that support the findings of this study are avail-able from the corresponding author upon reasonable request.