
Figures & data
Figure 1. LDED process and CDCT treatment of CrCoNi MEA samples: (a) LDED equipment employed in this work; (b) SEM image and corresponding EDS mappings of the gas-atomised CrCoNi MEA powders; (c) schematic diagram of the scanning strategy and sampling position for performance testing; (d) LDED-fabricated CrCoNi MEA bulk sample; (e) schematic illustration of CDCT process.
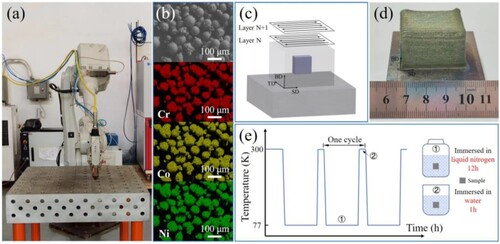
Table 1. LDED parameters employed for fabricating CrCoNi MEA samples.
Figure 2. (a) XRD patterns of CrCoNi MEA raw powders, as-built, CDCT-10, CDCT-20, and CDCT-30; (b) enlarged view of (111) peaks in (a).
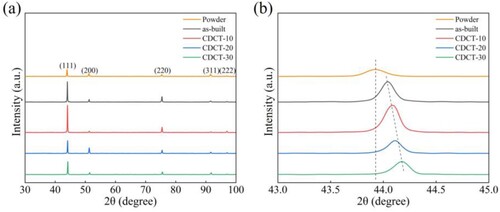
Figure 3. Residual stress measurements of as-built, CDCT-10, CDCT-20, and CDCT-30: (a) load-displacement curves and (b) estimated residual stresses.
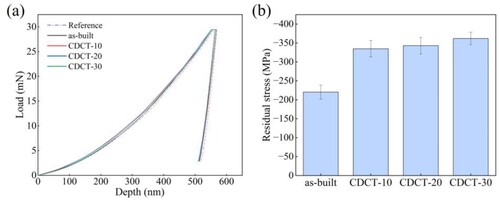
Figure 4. IPF maps (a1-d1), KAM maps (a2-d2), and GND density maps (a3-d3) of samples: (a) as-built, (b) CDCT-10, (c) CDCT-20, and (d) CDCT-30. (e) is the distribution of grain sizes. (f) is the average grain size, and average value of KAM and GND density.
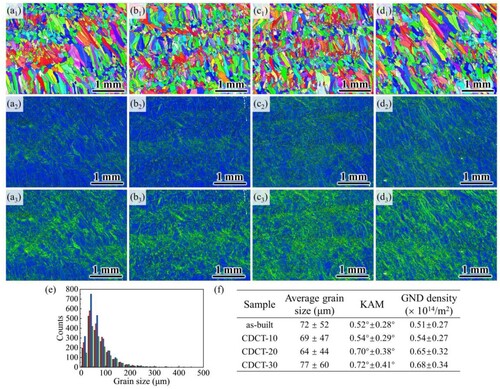
Figure 5. TEM images of (a) as-built, (b) CDCT-10, (c) CDCT-20, and (d) CDCT-30. The inset images in (a) and (b) are the corresponding g vector. The inset images in (c) and (d) are the corresponding SAED patterns.
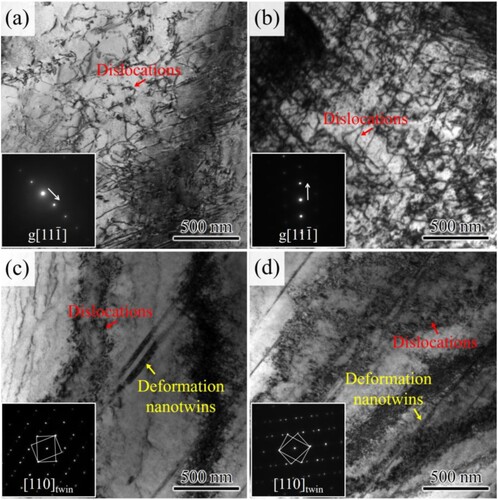
Figure 6. Electrochemical tests of as-built, CDCT-10, CDCT-20, and CDCT-30: (a) potentiodynamic polarisation curves; (b) Nyquist plots; (c) and (d) Bode plots. The inset in (a) is the enlarged view of passive potential range. The inset in (b) is the equivalent circuit model performed to analyze impedance plots.
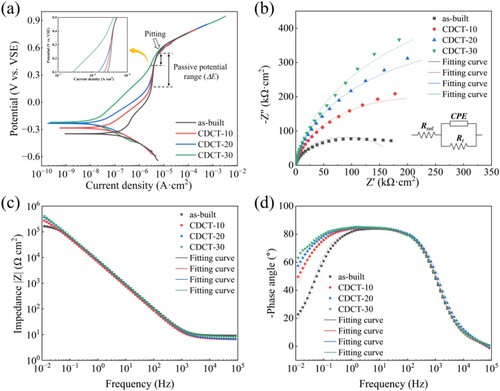
Table 2. The potential ranges used for Tafel extrapolation method.
Table 3. Summary of potentiodynamic polarisation test results of CrCoNi MEA in 3.5 wt% NaCl solution.
Figure 7. SEM images of corrosion morphology of (a) as-built, (b) CDCT-10, (c) CDCT-20, and (d) CDCT-30.
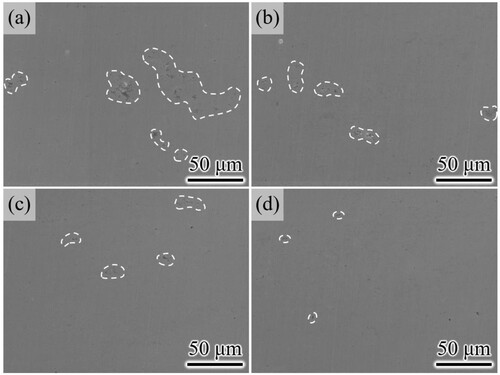
Table 4. Equivalent circuit fitting parameters for EIS results of as-built, CDCT-10, CDCT-20, and CDCT-30.
Figure 8. Results of wear tests of as-built, CDCT-10, CDCT-20, and CDCT-30: (a) friction coefficients; (b) wear rates.
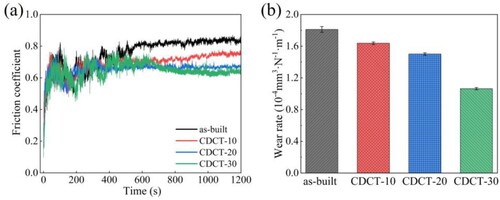
Figure 9. SEM images of the wear surfaces of the four samples: (a) as-built, (b) CDCT-10, (c) CDCT-20, and (d) CDCT-30. (f), (g), and (h) are the element analysis of (e) captured in as-built sample.
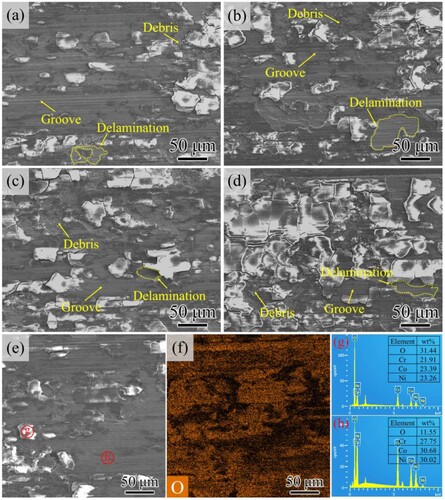
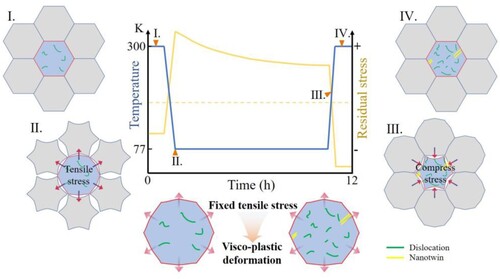
Figure 10. The schematic to illustrate the variation of microstructure and residual stress within the LDED-fabricated CrCoNi MEA during CDCT.
Data availability statement
The data that support the findings of this study are available from the corresponding author, [YJH], upon reasonable request.
