
Figures & data
Figure 1. (a) Powder characteristics and schematic illustration of the laser DED process. (b) Different TC11 bulk samples fabricated by hybrid manufacturing technique. (c) The relative positions of the metallographic samples and different kinds of tensile samples. (d) Schematic illustration of in-situ XRD tensile experimental setup. (e) Dimensions of rod-shaped specimens, DIC and in-situ XRD coupons, unit in mm. (f) The heat treatment path for the hybrid manufactured TC11 samples.
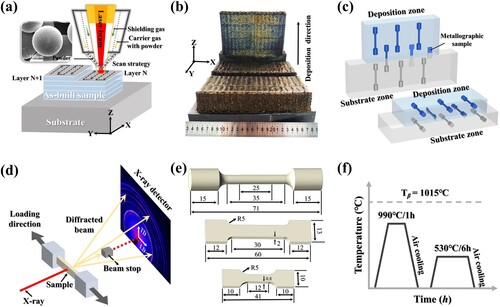
Table 1. Chemical composition of the LDZ and SZ (wt.%).
Figure 2. Microstructures of the as-deposited hybrid manufactured sample: (a) overview of the specimen composed by three different zones [Citation22]; OM and magnified SEM images for the (b)-(c) LDZ, (d)-(e) HAZ and (f)-(g) SZ, respectively.
![Figure 2. Microstructures of the as-deposited hybrid manufactured sample: (a) overview of the specimen composed by three different zones [Citation22]; OM and magnified SEM images for the (b)-(c) LDZ, (d)-(e) HAZ and (f)-(g) SZ, respectively.](/cms/asset/1a2a97bb-ca7d-4ae1-92e5-942cdd888c0b/nvpp_a_2382168_f0002_oc.jpg)
Figure 3. Microstructures of the heat-treated hybrid manufactured sample: (a) overview of the specimen; (b)-(c) OM and magnified SEM images for the LDZ and SZ, respectively; (d) overall microstructural characteristics for the HAZ; (e)-(g) microstructures of the dotted box at the corresponding locations in (d).
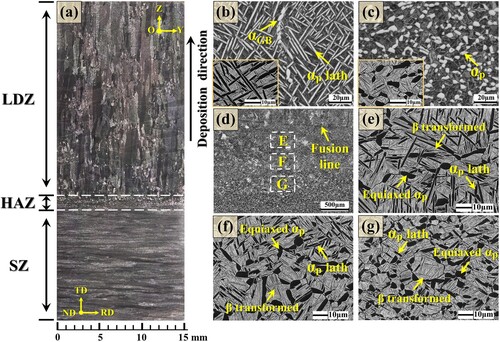
Figure 4. (a) The volume percentage of the αp phases and (b) the average aspect ratio of the αp laths and the average diameter of the equiaxed αp phases at different locations in the heat-treated hybrid manufactured TC11 alloy.
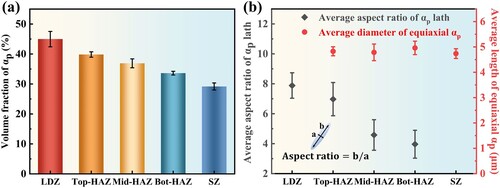
Figure 5. EBSD results of the as-deposited hybrid manufactured TC11 sample. (a) Reconstructed β-orientation map from the SZ to the LDZ and the corresponding (b) pole figures in the LDZ. Inverse pole figure orientation maps and pole figures of the α phases in the (c)-(d) LDZ and (e)-(f) SZ.
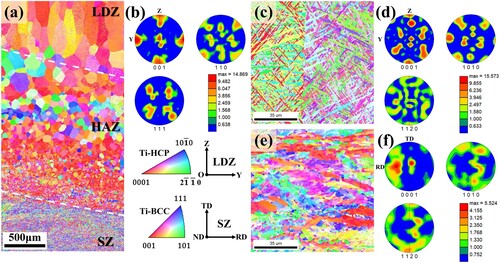
Figure 6. EBSD results of the heat-treated hybrid manufactured TC11 sample. (a) Reconstructed β-orientation map from the SZ to the LDZ and the corresponding (b) pole figures in the LDZ. Inverse pole figure orientation maps and pole figures of the α phases in the (c)-(d) LDZ and (e)-(f) SZ.
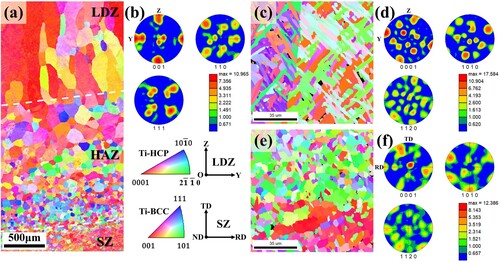
Table 2. Room temperature properties of the as-deposited and heat-treated hybrid manufactured TC11 alloy with the L-direction.
Figure 7. Tensile results of the L-direction heat-treated hybrid manufactured TC11 alloy. (a) Strain-stress curves of the heat-treated D-L, D + S-L and S samples. (b) Macroscopic image near the fracture and the crack propagate path within the β grains of the 990HT D + S-L sample. (c) DIC observations on deformation behaviours of the 990HT D + S-L sample over time.
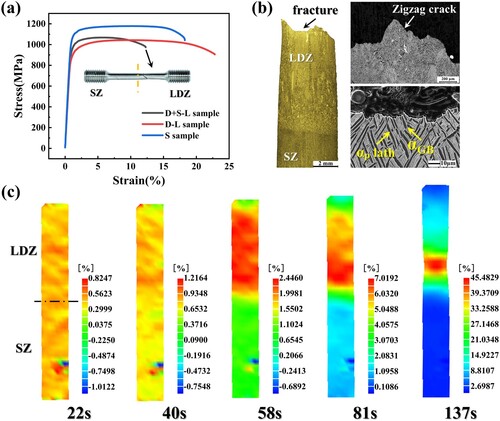
Figure 8. The in-situ XRD tensile test results of the 990HT D + S-L sample. XRD profiles of the un-strained sample in the (a) LDZ and (b) SZ. Evolution of the X-ray diffraction peaks positions in the (c), (e) LDZ and (d), (f) SZ in different tensile strains along the loading direction.
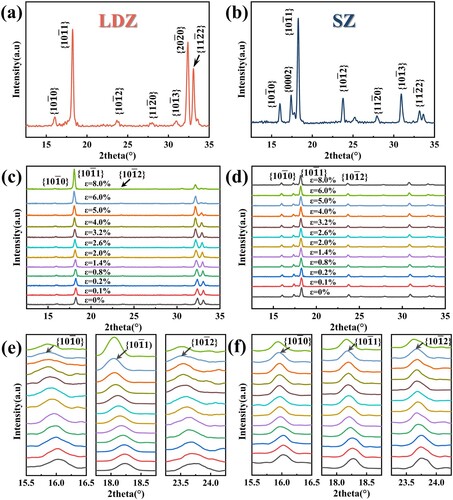
Figure 9. Evolution of the lattice strains in the (a) LDZ and (b) SZ of the 990HT D + S-L sample during the tensile deformation.
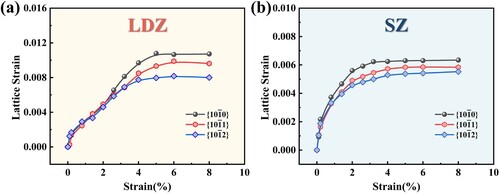
Table 3. Room temperature properties of the as-deposited and heat-treated hybrid manufactured TC11 alloy with the T-direction.
Figure 10. Tensile results of the T-direction heat-treated hybrid manufactured TC11 alloy. (a) Strain-stress curves of the 990HT D-T, D + S-T and S samples. (b) The elastic deformation stages of stress–strain curves of different samples. (c)-(e) OM and (f)-(h) SEM micrographs of cracks in the 990HT D-T, D + S-T and S samples, respectively.
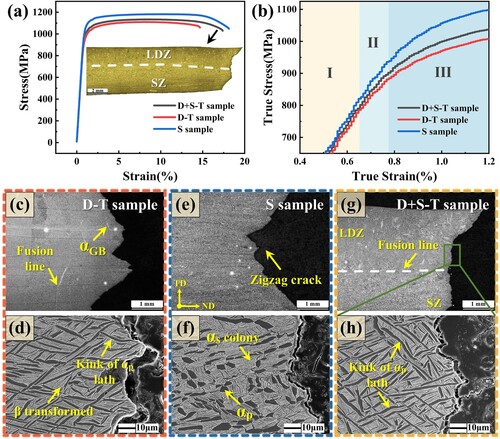
Figure 11. SEM images of the fracture for the different 990HT hybrid manufactured samples: (a)-(b) the D-T sample; (c)-(d) the S sample; (e)-(f) the D + S-T sample.
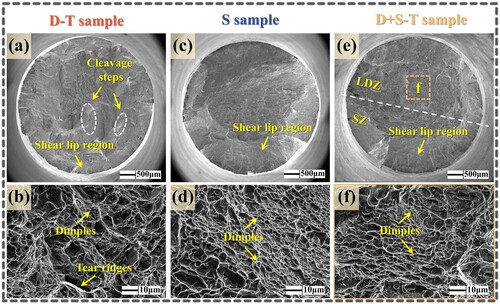
Figure 12. (a) DIC observations on deformation behaviours of the 990HT D + S-T sample over time. The results showing the strain evolution along a path aligned with the tensile direction over time in the (b) LDZ and (c) SZ.
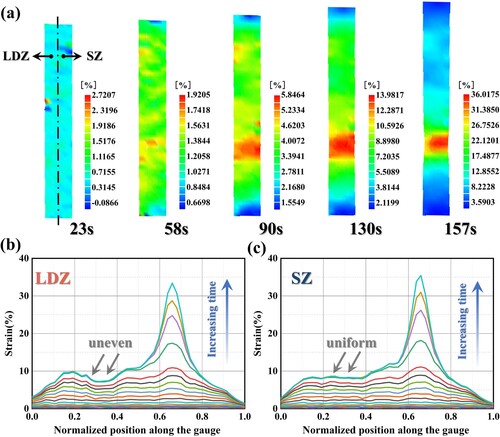
Figure 13. Longitudinal and transverse tensile properties of different samples in the as-deposited and 990HT states.
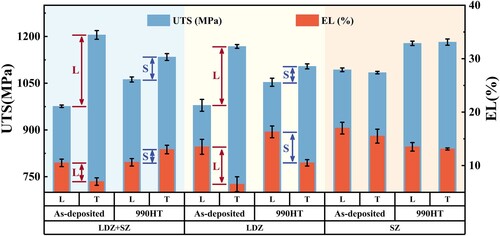
Figure 14. (a) The schematic illustration of the mismatch strength in the 990HT D + S-L sample. (b) The displacement-time curves of the selected points during DIC test in the tensile gauge length of the 990HT D + S-L sample.
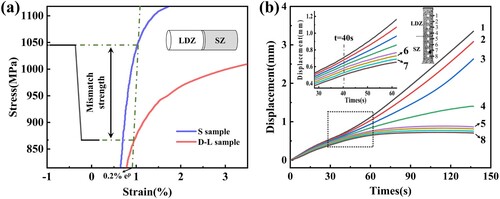
Figure 15. The crack propagation diagrams of the 990HT (a) D + S-L and (b) D + S-T samples.
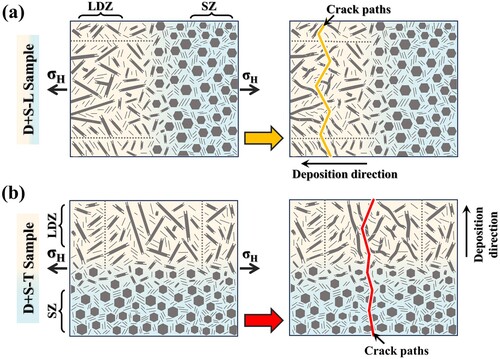
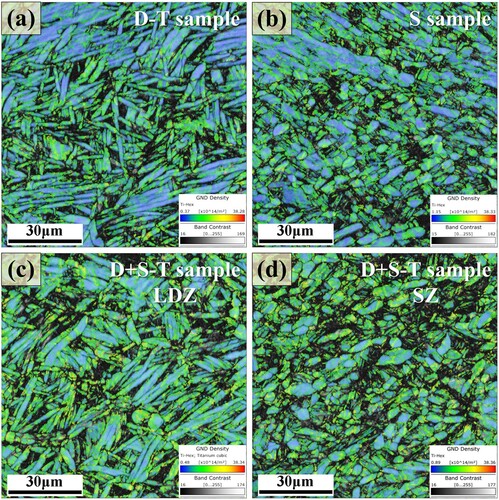
Figure 16. The GNDs density mappings at the same position of different tensile fracture samples: (a) the 990HT D-T sample; (b) the 990HT S sample; (c)-(d) the LDZ and SZ of the 990HT D + S-T sample, respectively.
Data availability statement
The data that support the findings of this study are available from the corresponding author upon reasonable request.