Figures & data
Figure 1. For each of the hospitals, the proportion of the total number of arthroplasties in which a particular antibiotic was used. The hospitals have been sorted according to the proportional use of cloxacillin (low to high).
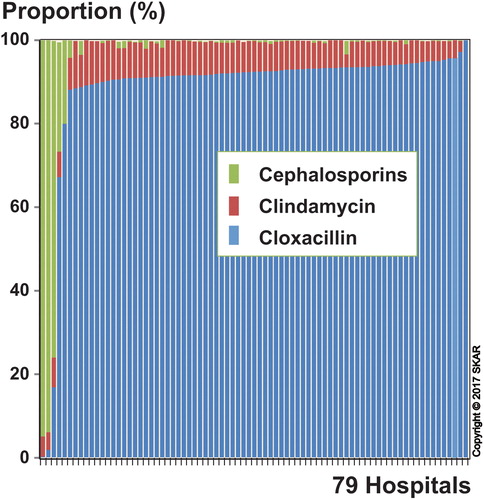
Figure 2. Cumulative hazard of being revised for infection after adjusting for age, sex, BMI, and ASA grade.
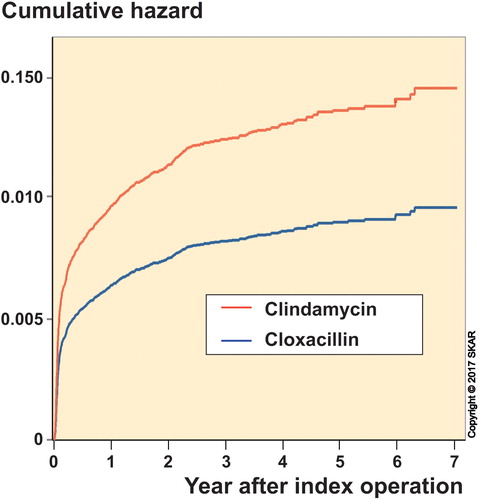
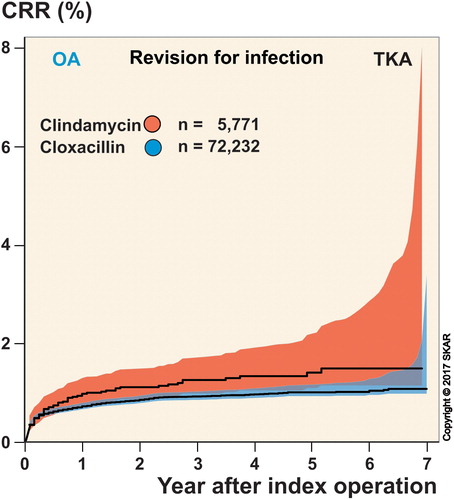
Figure 3. Unadjusted cumulative revision rate (CRR).