Figures & data
Figure 2. 1-year MTPM migration by fixation (cemented, n = 222; uncemented, n = 138). Boxes enclose 25th–75th percentiles with internal horizontal line at the median, whiskers extend a further 1.5 times the inter-quartile range and points beyond this range are plotted individually.
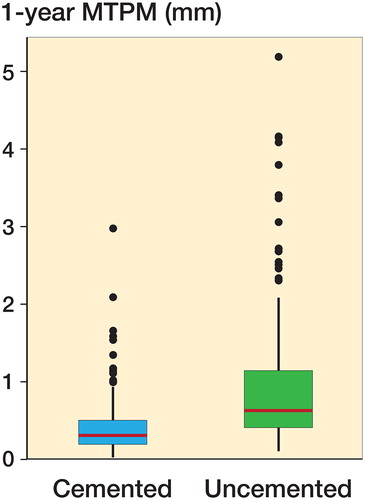
Table 6. Subject demographics by fixation (cemented and uncemented) and by implant design
Table 7. Tibial component 1-year MTPM migration and change in MTPM migration from 1 to 2 years by fixation and implant groups
Figure 3. 1-year MTPM migration for cemented and uncemented tibial components by implant design. Boxes enclose 25th–75th percentiles with internal horizontal line at the median, whiskers extend a further 1.5 times the inter-quartile range and points beyond this range are plotted individually.
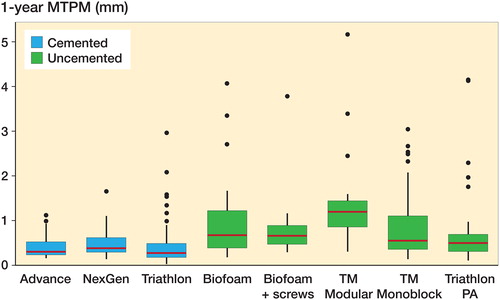
Figure 4. Change in MTPM migration from 1 to 2 years by fixation (cemented, n = 222; uncemented, n = 138). Boxes enclose 25th–75th percentiles with internal horizontal line at the median, whiskers extend a further 1.5 times the inter-quartile range and points beyond this range are plotted individually.
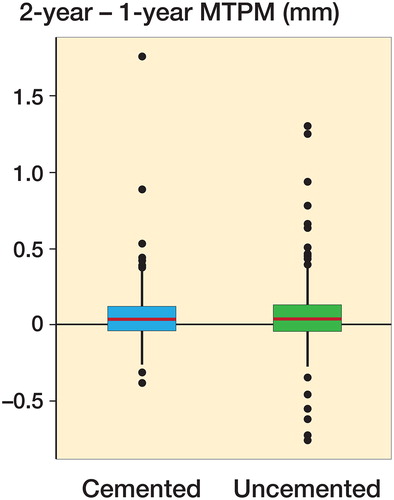
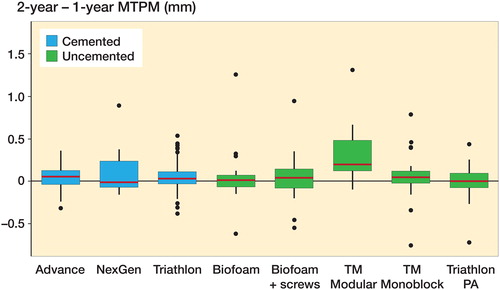
Figure 5. Change in MTPM migration from 1 to 2 years for cemented and uncemented tibial components by implant design. Boxes enclose 25th–75th percentiles with internal horizontal line at the median, whiskers extend a further 1.5 times the inter-quartile range and points beyond this range are plotted individually.