
Figures & data
Figure 1. Flowchart of the patients. TKA = total knee arthroplasty, RSA = radiostereometric analysis.
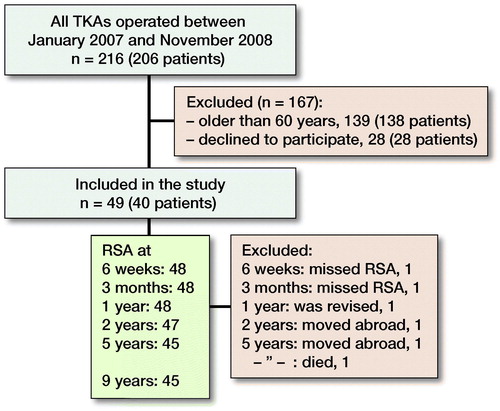
Table 1. Preoperative clinical data
Figure 2. Maximum migration (MTPM) for the NexGen Trabecular Metal posterior stabilized (PS) monoblock tibial component (red). For comparison values for the cruciate retaining (CR) variety of the same implant (blue) (Henricson and Nilsson Citation2016). Values are mean (95% confidence interval).
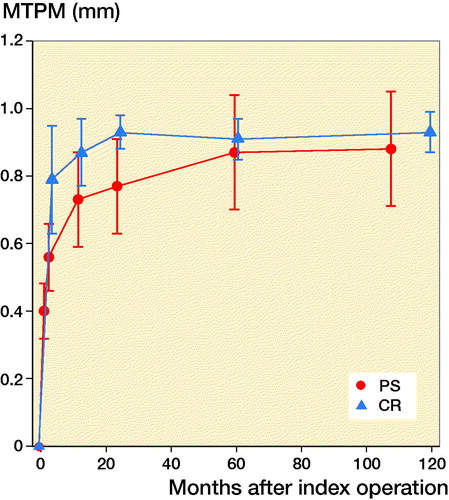
Figure 3. Maximum subsidence (negative y-axis translation) for the NexGen Trabecular Metal posterior stabilized (PS) monoblock tibial component (red). For legend, see .
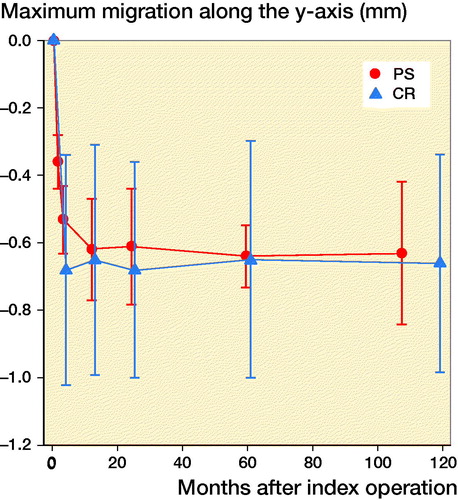
Figure 4. Rotation around the transverse (x-) axis of the knee (absolute values). For legend, see . The majority of the TM PS implants rotated into posterior tilt.
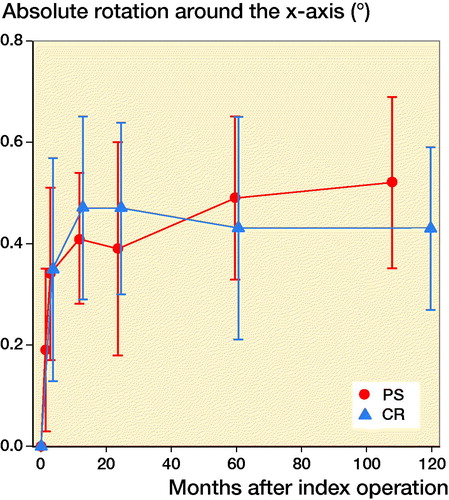
Figure 5. Rotation around the longitudinal (y-) axis of the knee (absolute values). For legend, see . The majority of the TM PS implants rotated externally.
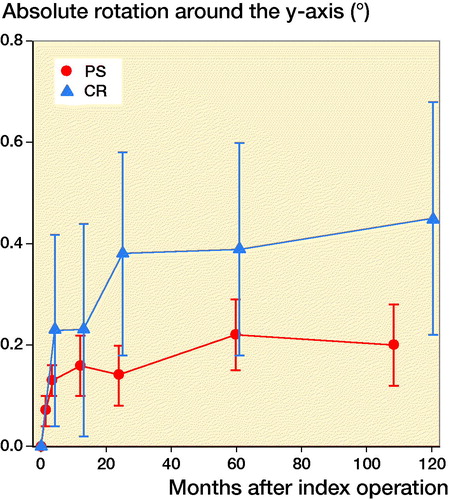
Figure 6. Rotation around the sagittal (z-) axis of the knee (absolute values). For legend, see . Rotation into varus or valgus was evenly distributed among the TM PS implants.
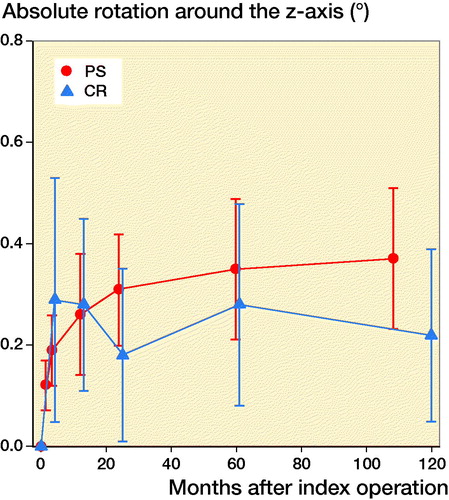
Figure 7. Individual MTPM values for the TM PS implants.
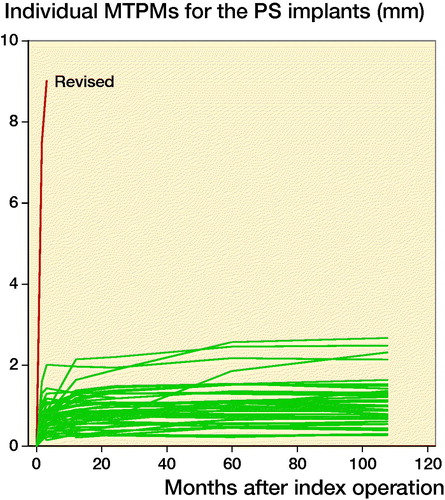
Table 2. Clinical and radiological data at the 9-year follow-up