
Figures & data
Figure 1. CONSORT flow chart.
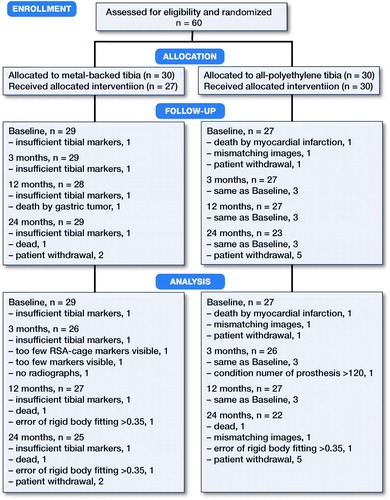
Table 1. Baseline demographic characteristics. Values are frequency unless otherwise stated
Figure 2. Mean (95% CI) MTPM in mm of the metal-backed tibial implant group (MBT) and the all-polyethylene tibial implant group (APT) at 3, 12, and 24 months follow-up. The MTPM of the 3 unstable implants is plotted and all 3 show continuous migration between 12 and 24 months’ follow-up.
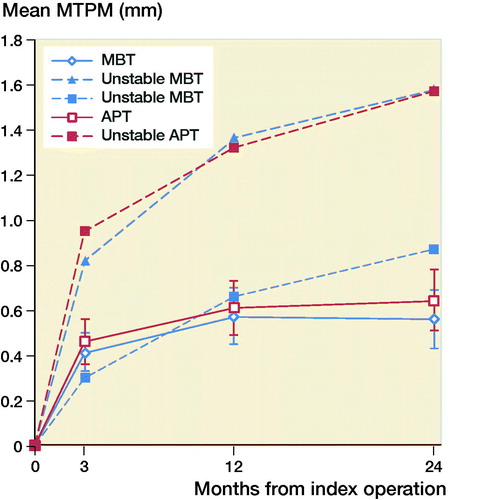
Figure 3. Mean translation along the longitudinal axis in mm with 95% confidence intervals. A positive value indicates tibial lift-off and a negative value indicates subsidence of the tibial implant.
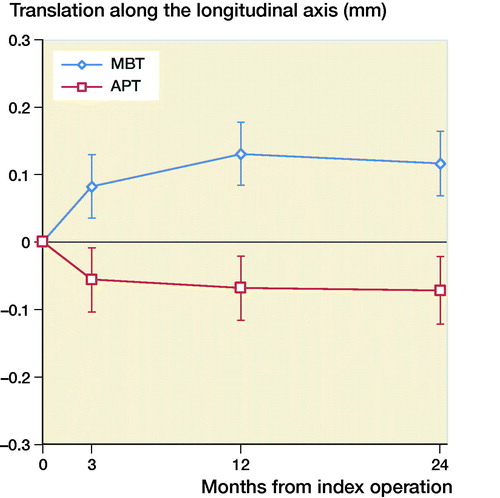
Figure 4. Mean rotation along the longitudinal axis in degrees with 95% confidence intervals. A positive value indicates internal rotation and a negative value indicates external rotation of the tibial implant.
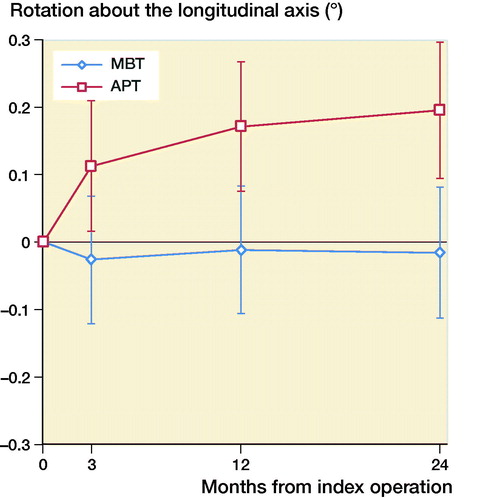
Figure 5. Mean rotation along the transverse axis in degrees with 95% confidence intervals. A positive value indicates forward tilting and a negative value indicates backward tilting of the tibial implant.
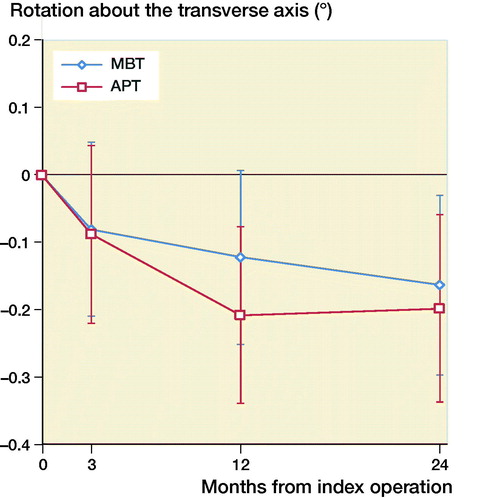
Table 2. Mean (95% CI) MTPM in mm of the metal-backed tibial implant group (MBT) and the all-polyethylene tibial implant group (APT) at 3, 12, and 24 months follow-up