
Figures & data
Table 1. Demographic data, postoperative mean (SD) and median (range) score of the FJS-12 and the KOOS domains
Figure 1. Distribution of scores 1 year after knee arthroplasty in FJS-12 and KOOS domains: Symptoms; Pain; Functions in daily life (ADL); Functions in sport and recreational activities (Sport/Rec), and Knee-related quality of life (QoL).
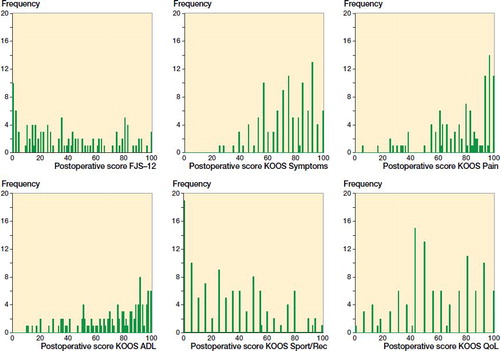
Table 2. Number (%) of patients with floor effect (0 points), ceiling effect (100 points) out of 109 patients