
Figures & data
Figure 1. Geometric mean whole blood Co values (left) and Cr levels (right) divided across the follow-up time before initial measurement.
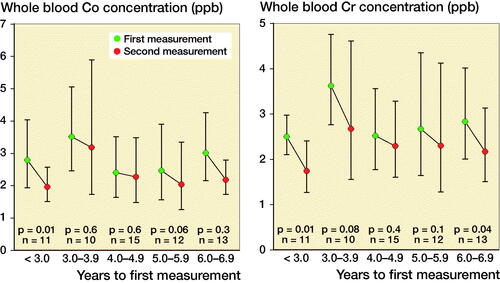
Figure 2. Changes in Cobalt (Co) and Chromium (Cr) ion levels compared to initial measurement
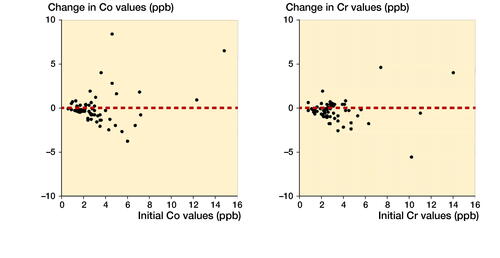
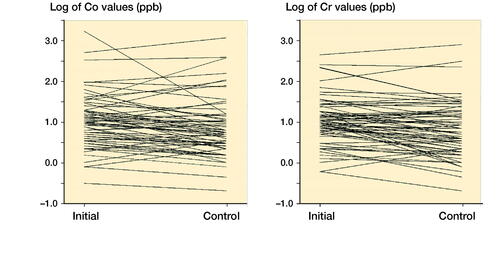
Figure 3. Spagetti plots for Co and Cr values at initial and control measurements. Values are naturally log-transformed.
Differences in WB Co and Cr levels (ppb)