
Figures & data
Figure 1. Data flowchart.
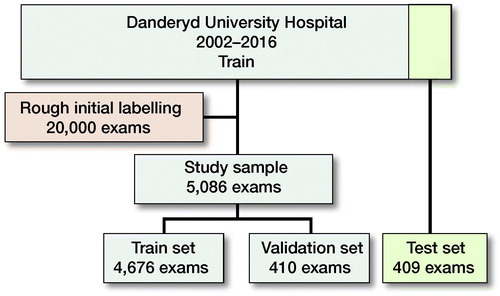
Table 1. Base distribution of fractures according to the AO classification. Values are count (%)
Table 3. Distribution of malleolar fractures by type (44A–C), specified by type, group, and subgroup. Values are count (%) for samples > 100
Figure 2. Distribution of AO classes in the malleolar fracture data.
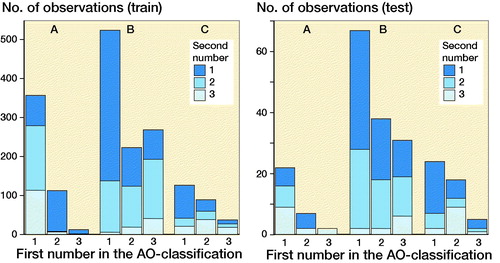
Table 4. Outcome measures for the most important groups and weighted average AUC for each malleolar AO type, group, and subgroup combined
Figure 3. The network failed to identify this image as a malleolar type A fracture. Among the malleolar fractures it was predicted as a type C fracture.
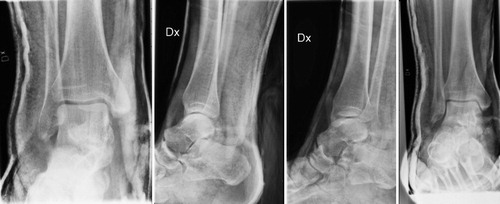
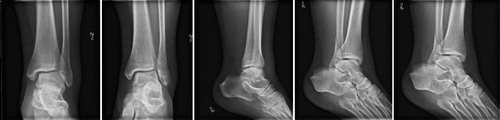
Figure 4. The examination should have been a malleolar type C fracture but the network predicted type B fracture.
Supplemental material