
Figures & data
Figure 1. Flowchart of the inclusion/exclusion process: selection process from DHR data retrieval to the return of questionnaires.
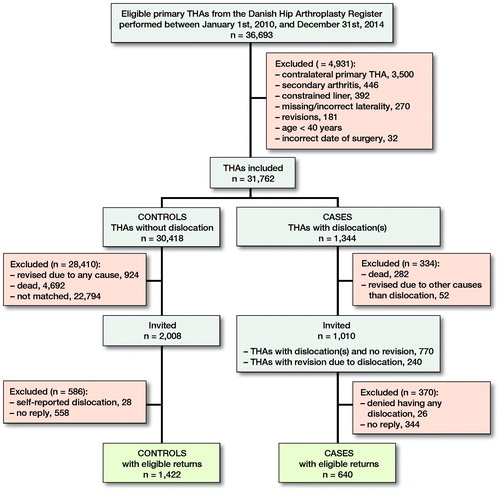
Table 1. Patient demographics. Values are percentage unless otherwise specified
Figure 3. HOOS domain scores presented as means with 95% CIs for all cases with dislocation, cases with dislocation and revision(s), and the control group. A score of 100 indicates no problems and 0 indicates extreme problems. We compared the control group with cases with dislocation (no revision) by multiple linear regression analysis adjusting for CCI and stated statistical significance for all 5 domains (p-value < 0.001).
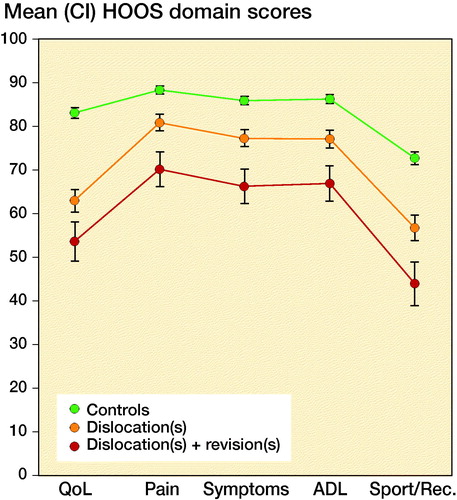
Figure 4. Predicted HOOS QoL score after hip dislocation: graph illustrating the predicted HOOS QoL domain score as a function of time elapsed since the latest dislocation, irrespective of the number of dislocations per patient.
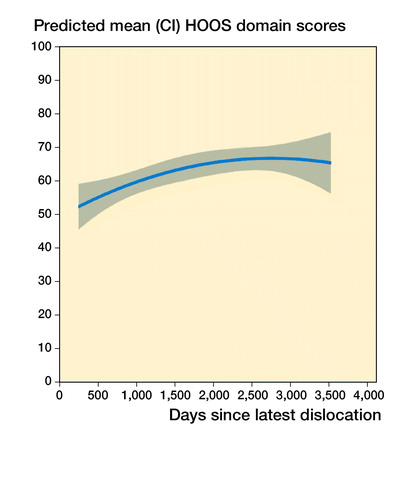
Table 2. HOOS results based on number of dislocations
Table 3. Differences in HOOS QoL score for patients with dislocation(s) depending on age, sex, and CCI, analyzed by multiple linear regression adjusted for number of dislocations, age, sex, and CCI
Table 4. Patient satisfaction. Values are % unless otherwise specified