
Figures & data
Table 1. Characteristics of TKA revisions for 2 selected indications between 1997 and 2018. Values are count (%) unless otherwise specified
Figure 1. Flowchart of TKA revision cases identified and included in the study analysis.
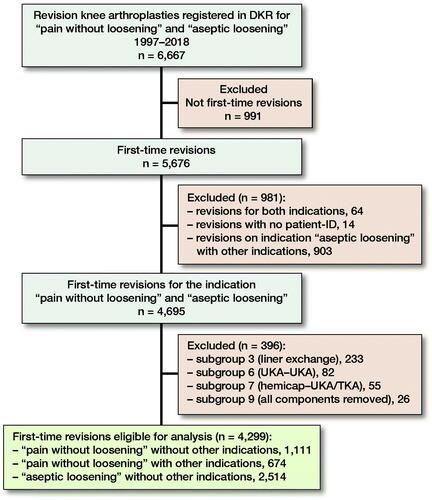
Figure 2. Incidence of TKA revision surgery for indications of “pain without loosening” with and without other indications and “aseptic loosening” without other indications. Data source = Danish Knee Arthroplasty Register, 1997–2018.
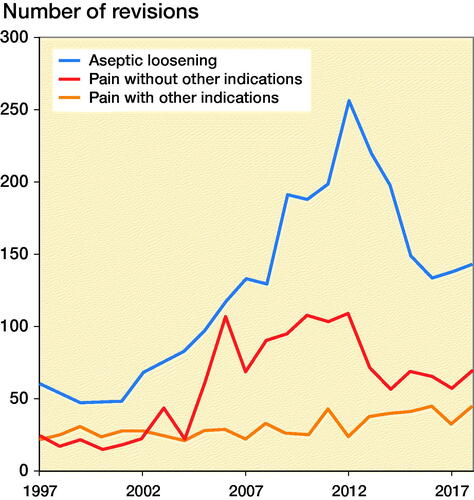
Figure 3. Kaplan–Meier survival curves with 95% confidence interval for the indications “pain without loosening” (without other indications) and “aseptic loosening” (without other indications).
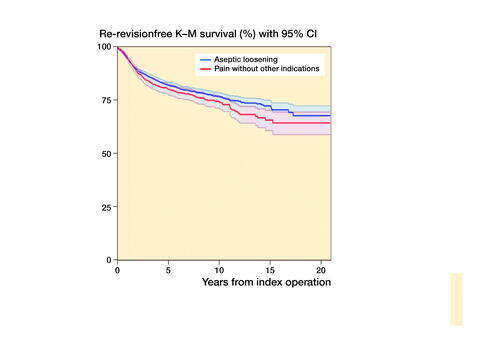
Table 3. Cumulated proportion of TKA re-revision after 2, 5, 10, 15, and 20 years by surgical indication. Values are count and percentage (CI)
Table 4. Cumulated proportion of TKA re-revision after 2, 5, 10, 15, and 20 years by surgical subgroup and indications of “pain without loosening” (without other indications) and “aseptic loosening” (without other indications). Values are count and percentage (CI)
Table 5. Risk of re-revision for secondary covariates adjusted for the effect of the primary exposure “indication”, calculated by Cox regression
Table 6. Cumulated proportion of TKA re-revision in 2 time-periods after 2, 5, and 8 years. Values are count and percentage (CI)
Figure 4. Kaplan-Meier curves over 2 time-periods for the indications “pain without loosening” (without other indications) and “aseptic loosening” (without other indications). Aseptic loosening 1997–2009 reference (HR 1); Aseptic loosening 2010–2018: HR 0.87 (CI 0.72–1.04), p = 0.1; Pain 1997–2009: HR 1.06 (CI 0.87–1.30), p = 0.6; Pain 2010–2018: HR 1.19 (CI 0.88–1.62), p = 0.3.
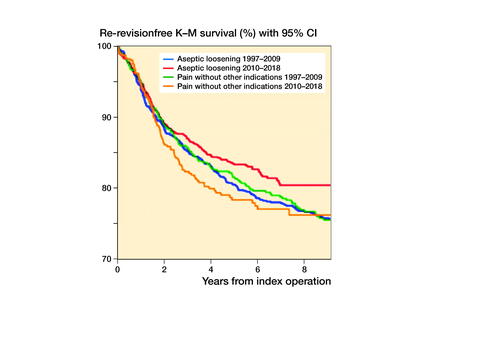
Table 7. Cumulated proportions of re-revision in 2 time-periods by subgroups and indications “pain without loosening” and “aseptic loosening” without any other indications. Values are count and percentage (CI)
Table 8. Reasons for re-revision for knee arthroplasties primarily revised for respectively “pain without loosening” and “aseptic loosening”. Values are count and percentage with [CI] in parentheses