
Figures & data
Table 1. Mean scores of voting intentions for no blame attribution versus blame attribution.
Table 2. Regression model predicting the effects of blame attribution and political distrust/cynicism on propensity to vote for a populist political party (PVV).
Figure 1. Interaction effect of blame attribution and political distrust/cynicism on propensity to vote for the governmental party VVD.
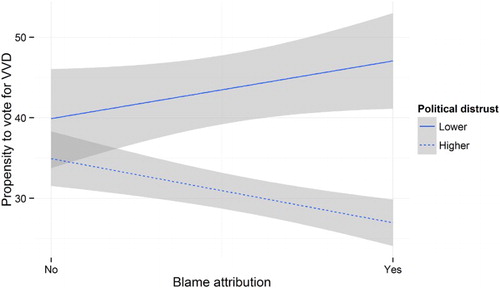
Table 3. Regression model predicting the effects of blame attribution and political distrust/cynicism on propensity to vote for the governmental party VVD.
Figure 2. Interaction effect of blame attribution and Dutch identity attachment on propensity to vote for the populist party PVV.
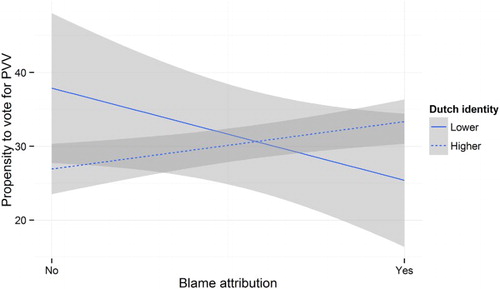
Figure 3. Interaction effect of blame attribution and European identity attachment on propensity to vote for the populist party PVV.
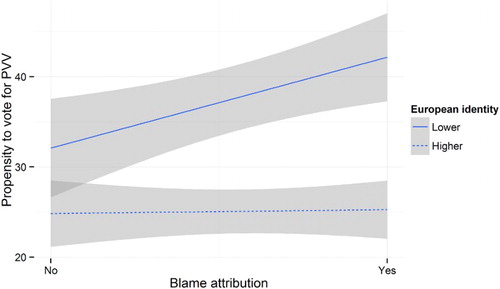
Table 4. Regression model predicting the effects of blame attribution and identity attachment on propensity to vote for a populist political party (PVV).
Figure 4. Three-way interaction effect of blame attribution and exclusionist identity attachment on propensity to vote for the populist party PVV.
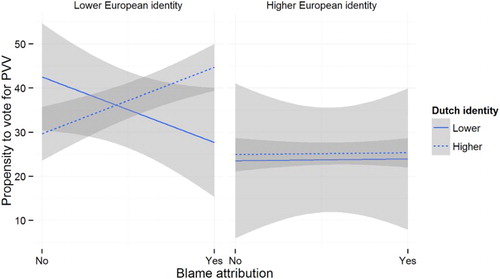
Figure 5. Mediation model demonstrating the mediating role of blame perceptions on the effects of blame attributions on populist party preferences. **p < .01; ***p < .001.
Supplemental material