Figures & data
Table 1. Datasets used, at a glance.
Figure 1. Evaluation of Trump and the Republican party by partisan identification; violin plots (a) Feeling thermometer for Donald Trump. (b) Feeling thermometer for the Republican party. Dataset A (US citizens, MTurk 1).
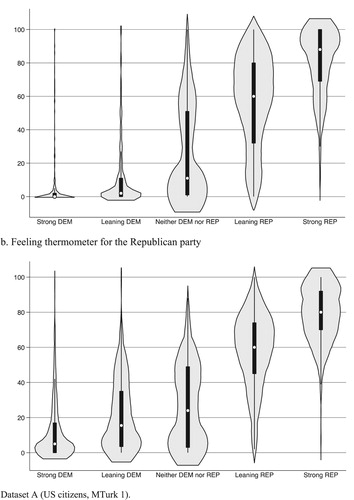
Figure 2. Evaluation of Trump and the Republican party by interest in politics * partisan identification; marginal effects. (a) Trump. (b) Republican party. Note: Dataset A (US citizens, MTurk 1). Marginal effects with 95% Confidence intervals, based on coefficients in model M3 in Table 1 (panel a) and Table 2 (panel b). Panel a. Dependent variable is evaluation of Trump (“feeling thermometer”) and varies between 0 “no warm feelings at all” and 100 “very warm feelings”. Panel b. Dependent variable is evaluation of the Republican party (“feeling thermometer”) and varies between 0 “no warm feelings at all” and 100 “very warm feelings”.
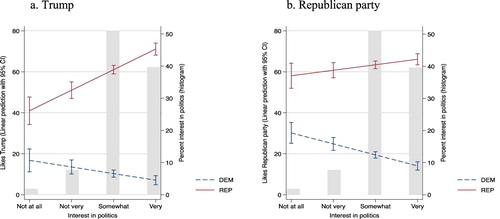
Figure 3. Evaluation of Trump and the Republican party by agreeableness * partisan identification; marginal effects. (a) Trump. (b) Republican party. Note: Dataset A (US citizens, MTurk 1). Marginal effects with 95% Confidence intervals, based on coefficients in model M3 in (panel a) and (panel b). Panel a. Dependent variable is evaluation of Trump (‘feeling thermometer’) and varies between 0 ‘no warm feelings at all’ and 100 ‘very warm feelings’. Panel b. Dependent variable is evaluation of the Republican party (‘feeling thermometer’) and varies between 0 ‘no warm feelings at all’ and 100 ‘very warm feelings’. Scores on the y-axis refer to the linear effect of agreeableness on that evaluation
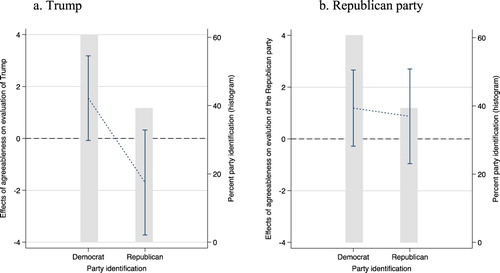
Figure 4. Trump Big Five and Dark Triad personality traits; comparing left-, center-, and right-leaning experts. Note: Dataset C (Experts, US Midterms). N(left) = 127–132; N(center) = 46–51; N(right) = 14. Ideological leaning based on self-reported score on the left-right scale: 0–3 ‘left’, 4–5 ‘center’, 6–10 ‘right’.
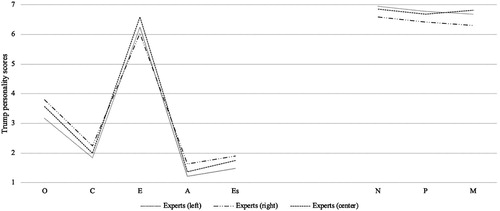
Table 2. Experts evaluate the personality of Trump (by ideology).
Table 3. US citizens evaluate the personality of Trump (by ideology).
Table 4. Dutch students evaluate the personality of Trump (by ideology).
Figure 5. Trump Big Five and Dark Triad personality traits; comparing experts, American citizens and Dutch students (by ideology). (a) Left-leaning respondents (1–3 on left-right scale). (b) Center-leaning respondents (4–5 on left-right scale). (c) Right-leaning respondents (6–10 on left-right scale). Note: Comparison of scores from Dataset B (US citizens, MTurk 2), Dataset C (Experts, US Midterms), and Dataset F (Dutch students, sample 1) Ideological leaning based on self-reported score on the left-right scale: 0–3 ‘left’, 4–5 ‘center’, 6–10 ‘right’.
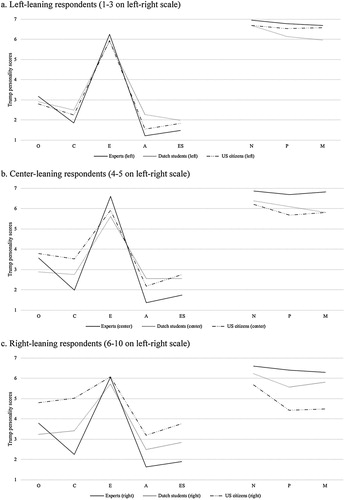
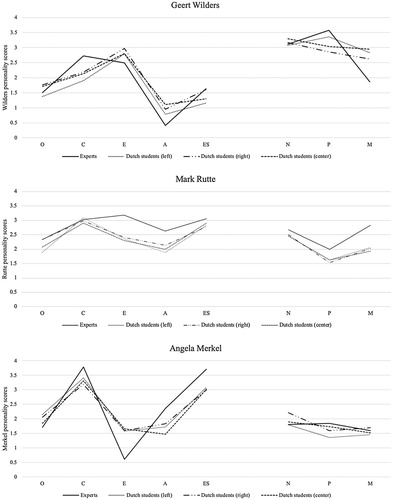
Figure 6. The personality of Wilders, Rutte, and Merkel; comparing evaluations by experts and Dutch students (by ideology). Notes: Comparison of scores from Dataset D (Experts, Netherlands election 2017), Dataset D (Experts, Germany election 2017), and Dataset G (Dutch students, sample 2). Ideological leaning based on self-reported score on the left-right scale: 0–3 ‘left’, 4–5 ‘center’, 6–10 ‘right’. Personality evaluations range from 0 ‘very low’ to 4 ‘very high’. See table A1 in the appendix for full scores.