1,695
Views
10
CrossRef citations to date
0
Altmetric
Research Article

Gold nanoparticles and ions – friends or foes? As they are seen by human cells U-937 and HL-60

&
Pages 564-580 | Received 11 May 2015, Accepted 14 Sep 2015, Published online: 13 Oct 2015

Figures & data

Figure 1. Ultraviolet–visible spectrum of gold nanoparticle suspension obtained with the use of tannic acid.
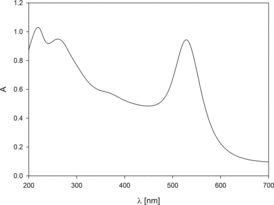
Figure 1. Ultraviolet–visible spectrum of gold nanoparticle suspension obtained with the use of tannic acid.

Figure 2. Geometrical characteristics of obtained nanoparticles: main plot – the size distribution of nanoparticles, insets: TEM micrograph of nanoparticles deposited on copper grid.
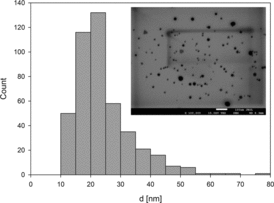
Figure 2. Geometrical characteristics of obtained nanoparticles: main plot – the size distribution of nanoparticles, insets: TEM micrograph of nanoparticles deposited on copper grid.

Figure 3. The dependence of the hydrodynamic diameter of nanoparticles on pH determined for ionic strength: (•)10−3 M NaCl and (○) 10−2 M NaCl. Measurement conditions: suspension concentration cp = 100 mg/l, T = 298 K. The solid line is a guide to the eye.
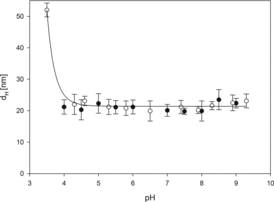
Figure 3. The dependence of the hydrodynamic diameter of nanoparticles on pH determined for ionic strength: (•)10−3 M NaCl and (○) 10−2 M NaCl. Measurement conditions: suspension concentration cp = 100 mg/l, T = 298 K. The solid line is a guide to the eye.

Figure 4. The dependence of zeta potential of gold nanoparticles on pH for ionic strength 102 M NaCl. Measurement conditions: concentration of suspensions cp = 100 mg/l, T = 298 K. The solid line is a guide to the eye.
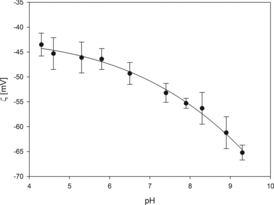
Figure 4. The dependence of zeta potential of gold nanoparticles on pH for ionic strength 10–2 M NaCl. Measurement conditions: concentration of suspensions cp = 100 mg/l, T = 298 K. The solid line is a guide to the eye.

Figure 5. Changes of cell viability due to contact with AuN. Cell viability was measured by the MTT assay and the viability of the treated group was expressed as a percentage of the control group (cells not treated). (a) U-937 cells or (b) HL-60. Cells were incubated with AuN for 24, 48 and 72 h. Data points are means ± standard deviations (three determinations).
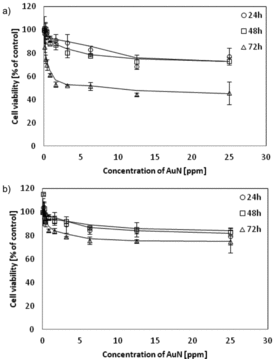
Figure 5. Changes of cell viability due to contact with AuN. Cell viability was measured by the MTT assay and the viability of the treated group was expressed as a percentage of the control group (cells not treated). (a) U-937 cells or (b) HL-60. Cells were incubated with AuN for 24, 48 and 72 h. Data points are means ± standard deviations (three determinations).

Figure 6. The dependence of cell viability on AuN concentration. (a) U-937 cells were activated in 1 day with 1 μM PMA and (b) HL-60 cells were differentiated during 6 days: to macrophages using 3 nM PMA or to granulocytes with 1.5% DMSO. Cell viability was measured by the MTT assay and the viability of the treated group was expressed as a percentage of the control group (cells not treated by AuN). After that cells were incubated with AuN for 24 h. Data points are means ± standard deviations (three determinations).
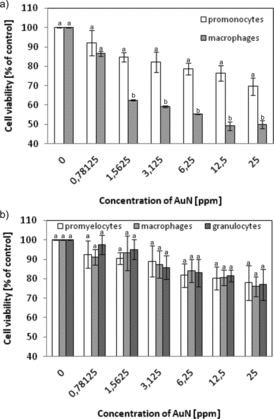
Figure 6. The dependence of cell viability on AuN concentration. (a) U-937 cells were activated in 1 day with 1 μM PMA and (b) HL-60 cells were differentiated during 6 days: to macrophages using 3 nM PMA or to granulocytes with 1.5% DMSO. Cell viability was measured by the MTT assay and the viability of the treated group was expressed as a percentage of the control group (cells not treated by AuN). After that cells were incubated with AuN for 24 h. Data points are means ± standard deviations (three determinations).

Figure 7. Cell viability after effluent (remains of the synthesis of AuN) treatment. U-937 and HL-60 cells were incubated for 24 h with effluent (diluted the same way as gold sol). Cell viability was measured by the MTT assay and the viability of the treated group was expressed as a percentage of the control group. Data points are means ± standard deviations (three determinations).
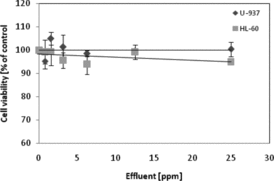
Figure 7. Cell viability after effluent (remains of the synthesis of AuN) treatment. U-937 and HL-60 cells were incubated for 24 h with effluent (diluted the same way as gold sol). Cell viability was measured by the MTT assay and the viability of the treated group was expressed as a percentage of the control group. Data points are means ± standard deviations (three determinations).

Figure 8. Effect of gold ions on the survival of original and differentiated U-937 and HL-60 cells. Cell viability was measured by the MTT assay and the viability of the treated group was expressed as a percentage of the control group (cells not treated). (a) U-937 cells were activated in 1 day with 1 μM PMA and (b) HL-60 cells were differentiated in 6 days: to macrophages using 3 nM PMA or to granulocytes with 1.5% DMSO. After that cells were incubated with HAuCl4 for 24 h. Data points are means ± standard deviations (three determinations).
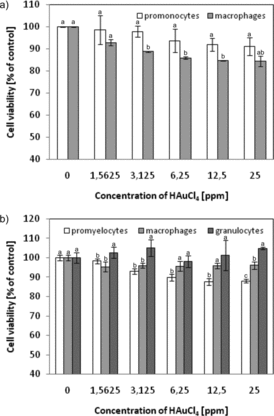
Figure 8. Effect of gold ions on the survival of original and differentiated U-937 and HL-60 cells. Cell viability was measured by the MTT assay and the viability of the treated group was expressed as a percentage of the control group (cells not treated). (a) U-937 cells were activated in 1 day with 1 μM PMA and (b) HL-60 cells were differentiated in 6 days: to macrophages using 3 nM PMA or to granulocytes with 1.5% DMSO. After that cells were incubated with HAuCl4 for 24 h. Data points are means ± standard deviations (three determinations).

Figure 9. Levels of NO secretion due to AuN treatment of (a) U-937 cells or (b) HL-60 cells differentiated or not. NO production was quantified spectrophotometrically using the Griess reagent. Cells were treated with AuN with the indicated concentrations for 24 h. Data points are means ± standard deviations (three determinations).
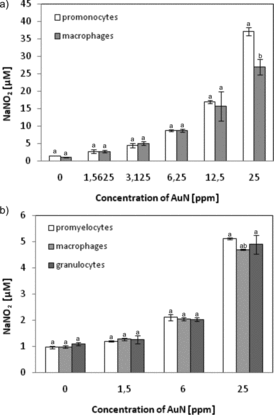
Figure 9. Levels of NO secretion due to AuN treatment of (a) U-937 cells or (b) HL-60 cells differentiated or not. NO production was quantified spectrophotometrically using the Griess reagent. Cells were treated with AuN with the indicated concentrations for 24 h. Data points are means ± standard deviations (three determinations).
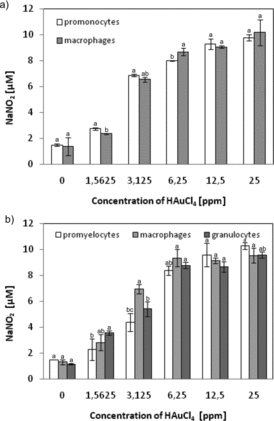
Figure 10. NO production by cells treated with gold salt (HAuCl4). (a) U-937 cells or (b) HL-60 cells differentiated or not. NO level was quantified spectrophotometrically using the Griess reagent. Cells were treated with HAuCl4 with the indicated concentrations for 24 h. Data points are means ± standard deviations (three determinations).

Figure 10. NO production by cells treated with gold salt (HAuCl4). (a) U-937 cells or (b) HL-60 cells differentiated or not. NO level was quantified spectrophotometrically using the Griess reagent. Cells were treated with HAuCl4 with the indicated concentrations for 24 h. Data points are means ± standard deviations (three determinations).
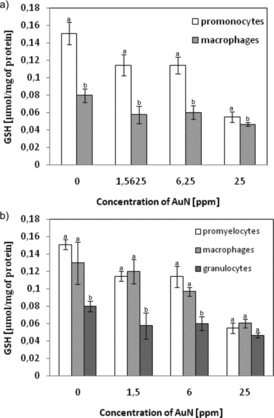
Figure 11. Concentration of intracellular GSH in (a) U-937 or (b) HL-60 cells treated for 24 h by AuN at various doses. Data points are means ± standard deviations (three determinations).

Figure 11. Concentration of intracellular GSH in (a) U-937 or (b) HL-60 cells treated for 24 h by AuN at various doses. Data points are means ± standard deviations (three determinations).

Reprints and Corporate Permissions

Please note: Selecting permissions does not provide access to the full text of the article, please see our help page How do I view content?

To request a reprint or corporate permissions for this article, please click on the relevant link below:

Academic Permissions

Please note: Selecting permissions does not provide access to the full text of the article, please see our help page How do I view content?

Obtain permissions instantly via Rightslink by clicking on the button below:

If you are unable to obtain permissions via Rightslink, please complete and submit this Permissions form. For more information, please visit our Permissions help page.