Figures & data
Table 1. Physical properties of alumina nanoparticles.
Figure 1. Experimental set-up (a) constant temperature thermal bath with ultrasonication device in use and (b) viscometer set-up.
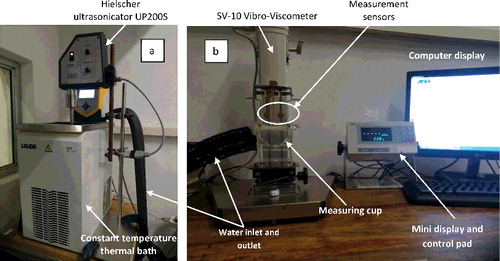
Figure 2. TEM image of Al2O3: (a) 20–30 nm, (b) 80 nm, (c) 100 nm.
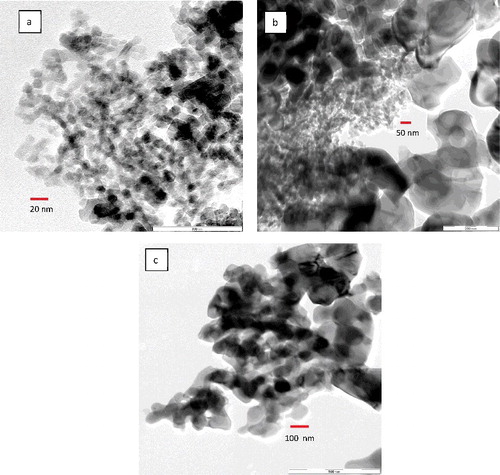
Figure 3. Size distribution of Al2O3 nanoparticles: (a) 20–30 nm, (b) 80 nm, (c) 100 nm.
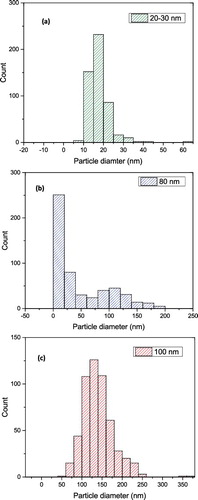
Figure 4. X-ray diffraction pattern for Al2O3 nanoparticles: (a) 20–30 nm, (b) 80 nm, (c) 100 nm. The black font represents corundum and the blue font represents millosevichite.
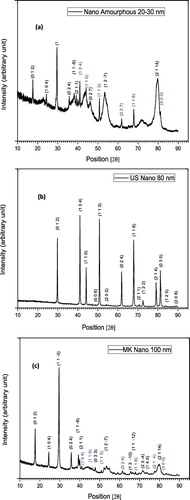
Figure 5. UV–visible spectra analysis of Al2O3–glycerol nanofluid (a, b and c) spectra pattern at different volume fractions and wavelengths for 20–30, 80 and 100 nm, respectively, and (d, e and f) absorbance of Al2O3 in glycerol at different concentrations and 230 nm wavelength for 20–30, 80 and 100 nm, respectively.
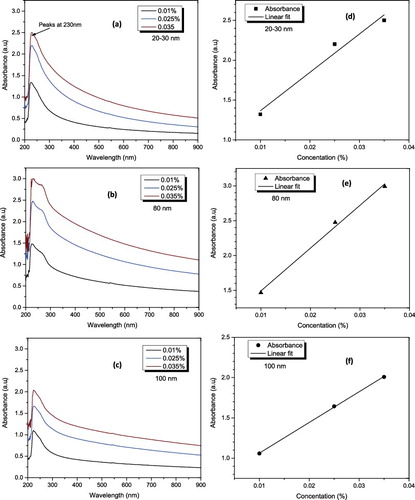
Figure 6. In situ nanoparticle size distribution in glycerol base fluid using DLS technique: (a) 20–30 nm, (b) 80 nm, (c) 100 nm.
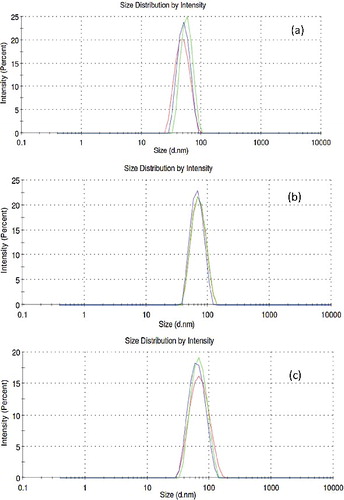
Table 2. pH and zeta potential values for the Al2O3–glycerol nanofluids at 20 °C.
Figure 7. Comparison of measured viscosity values of glycerol with available data. The horizontal bar shown on the experimental data point represents the standard deviation of the experimental values.
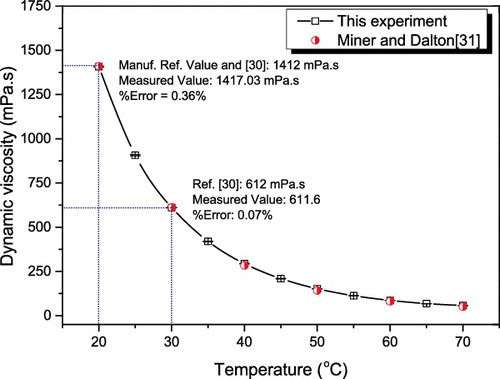
Figure 8. Effect of ultrasonication time on effective viscosity: (a) 2% volume fraction, (b) 3% volume fraction.
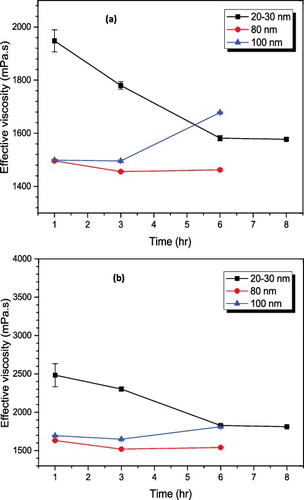
Figure 9. Effect of temperature on viscosity of Al2O3–glycerol nanofluids: (a) 20–30 nm, (b) 80 nm, (c) 100 nm. Results represent the viscosity value at 3-hour ultrasonication.
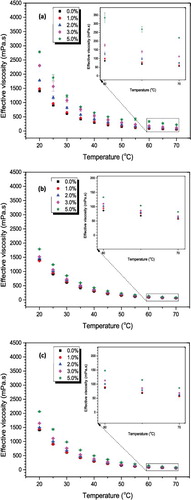
Figure 10. Relative viscosity plots showing the combined effect of particle size and increase in volume fraction at different ultrasonication periods.
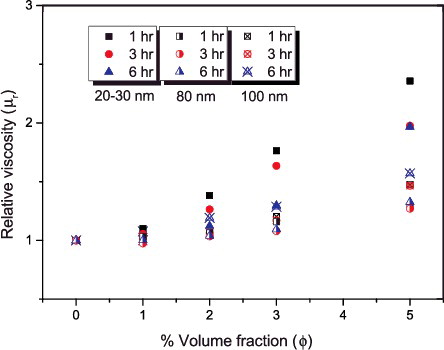
Figure 11. Sedimentation rate of Al2O3–glycerol nanofluids for 5% Al2O3 concentration (a) prepared with 4.99 × 10⁶ kJ/m3, after 3 months of preparation; (b) and (c) prepared with 1.5 × 10⁷ and 3.0 × 10⁷ kJ/m3, respectively, after 12 months of preparation: (A) 20–30 nm, (B) 80 nm, (C) 100 nm.
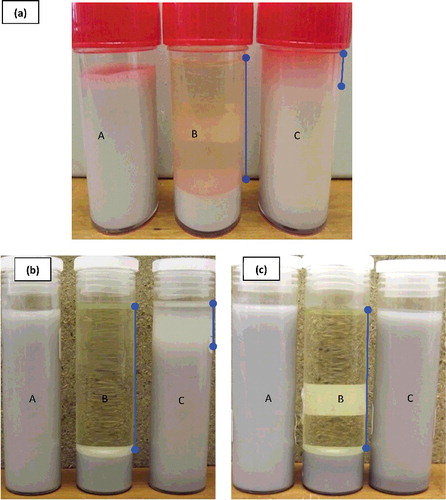
Figure 12. Model performance for prediction of the required energy density for Al2O3–glycerol nanofluids.
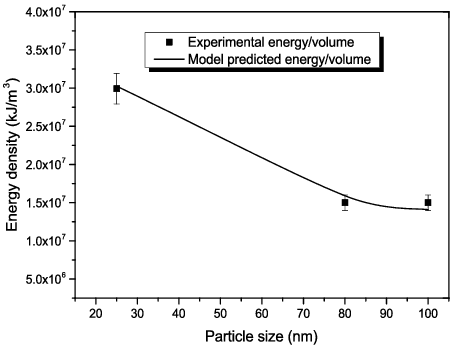
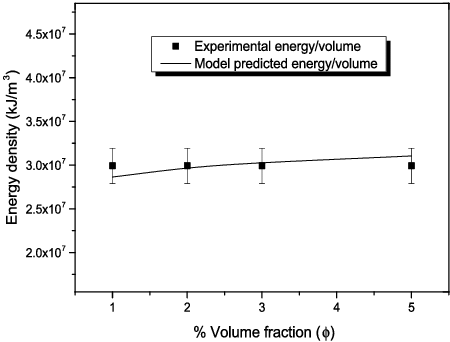
Figure 13. Performance of the model at different volume fractions for 20–30 nm Al2O3–glycerol nanofluid.