Figures & data
Table 1. Factors and levels for L9 orthogonal array.
Table 2. L9 orthogonal array layout and the measured response.
Figure 1. XRD patterns of DGC-ZSM-5 and HT-ZSM-5 samples.
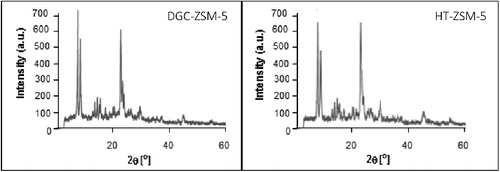
Figure 2. SEM images of (a) DGC-ZSM-5 and (b) HT-ZSM-5 samples.
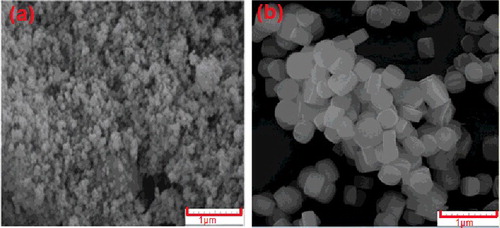
Figure 3. XRD patterns of all the ZSM-5 sample synthesized by dry gel conversion method (DGC).
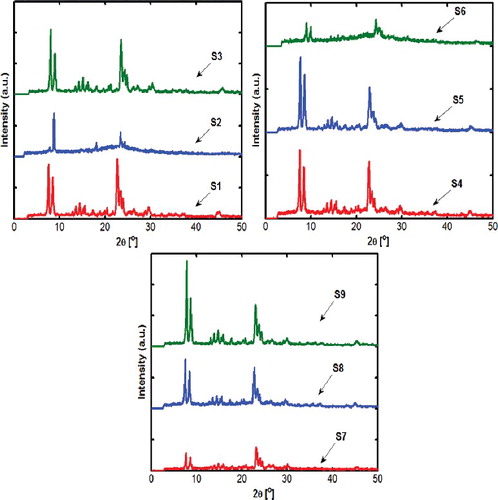
Figure 4. SEM images of ZSM-5 crystals synthesized by dry gel conversion method (DGC)
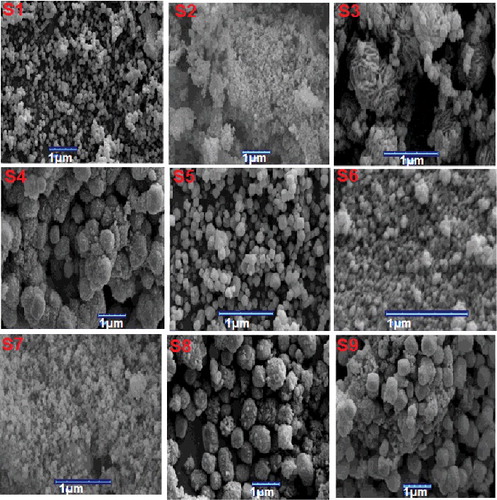
Table 3. The mean response table of S/N ratio for crystallinity.
Table 4. The mean response table of S/N ratio for particle size.
Figure 5. (a) Contribution of effect of each factor: (a) on the crystallinity and (b) on the particle size.
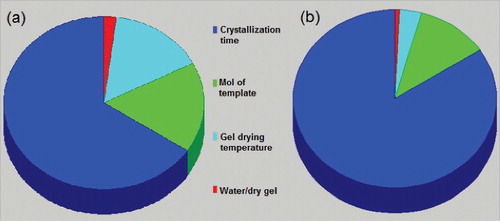
Figure 6. Effects of water/dry gel mass ratio: (a) on the crystallinity (b) on the particle size.
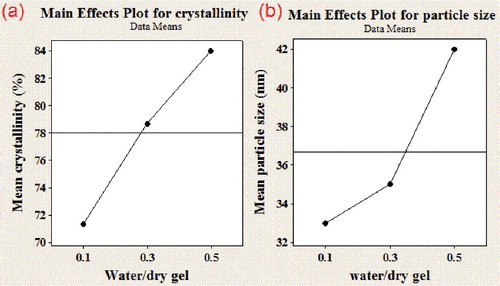
Figure 7. Effects of time of crystallization: (a) on the crystallinity (b) on the particle size.
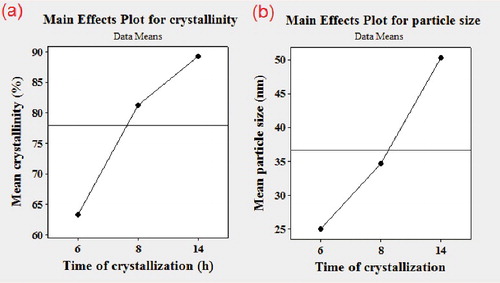
Figure 8. Effects of template molar ratio: (a) on the crystallinity (b) on the particle size.
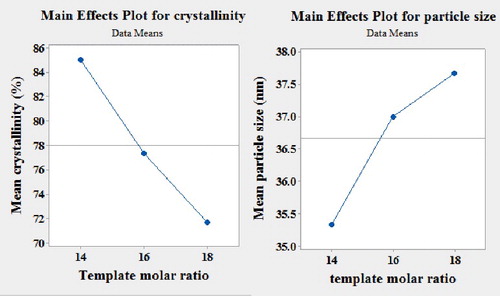
Figure 9. Effects of gel drying temperature: (a) on the crystallinity (b) on the particle size.
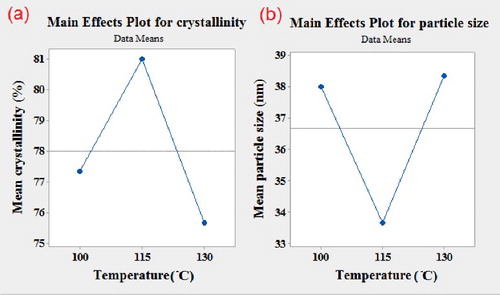
Figure 10. Methanol conversion vs time on stream (371 °C, 1 atm, WHSV = 2 h−1).
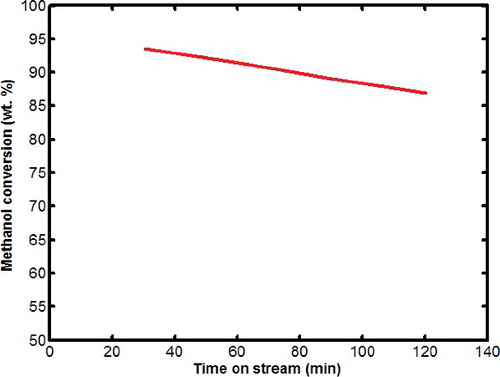
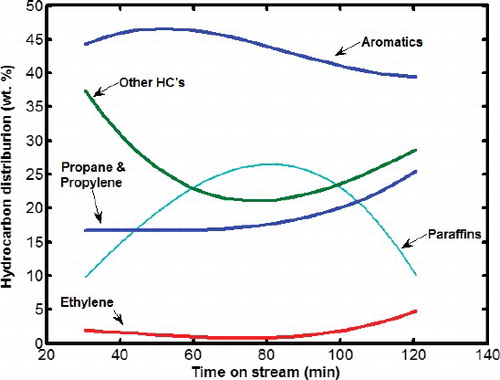
Figure 11. Product distribution vs time on stream (371 °C, 1 atm, WHSV = 2 h−1).