Figures & data
Figure 1. The cross-linking method for constructing a genipin conjugated by sericin hydrogels (Gen-SH).
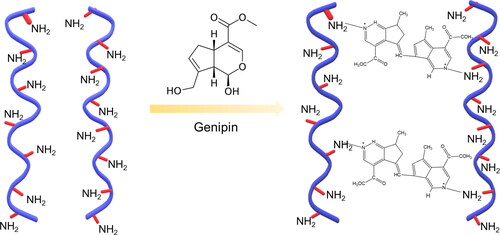
Figure 2. Physicochemical characterizations of a genipin conjugated by sericin hydrogels (Gen-SH). (A) FT-IR spectra of Gen-SH and sericin. (B) The Gen-SH image presents the porous structure of a Gen-SH examined by SEM. Scale bar 50 µm.
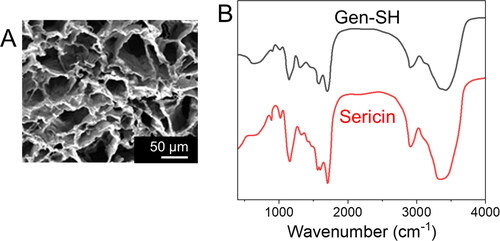
Figure 3. (A) The stress-strain response of a Gen-SH. (B) The growth and equilibrium swelling percentages of the Gen-SH. (C) The Gen-SH degradation immersed at 37 °C in PBS over time.
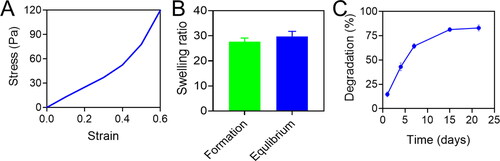
Figure 4. (A) The representative images demonstrate the morphology of primary cortical neurons planted on a Gen-SH after 2 days. (B) The representative confocal images showing the phalloidin-rhodamine-staining for DAPI staining and F-actin Scale bar 20 μm. (C–E) Quantify the cell body area, perimeter and long diameter. N.S. Non-significant.
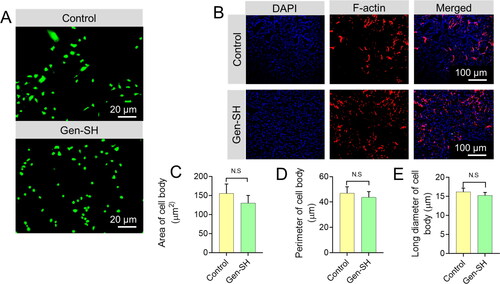
Figure 5. Gen-SH supports neuronal cells (B35) in vitro long-term growth. (A) The characteristic images indicate that the cells grew on the 24-well plate (untreated) for 17 days. Scale bar 20 μm. (B) The CCK-8 assay was used for evaluating B35 cell viability. N.S. Non-significant.
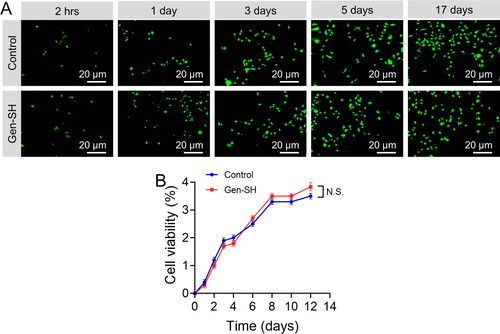
Figure 6. (A) The Live and Dead staining for primary cortical neurons 24 hrs after being treated with the sericin (SS) solution. (B) Quantification of the percentage of living cells examined by Live and Dead staining. C) CCK-8 assay.
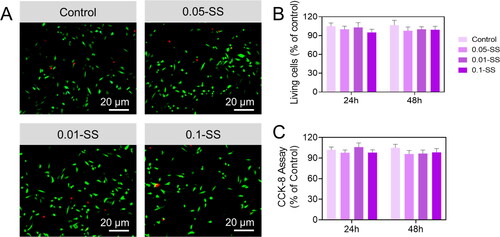
Figure 7. (A) The Live and Dead staining for primary cortical neurons 24 hrs after being treated with the Gen-SH degraded derivatives (SD). (B) Quantification of the percentage of living cells examined by Live and Dead staining. C) CCK-8 assay.
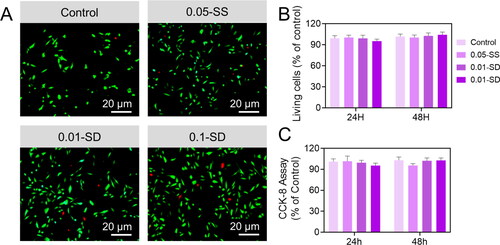
Figure 8. Neuroprotective properties of the sericin oxygen-glucose deprivation (OGD) injury. (A) The neurons were treated with PBS, BSA and the sericin solution (SS) Live and Dead staining. (B) Quantifications of the ratio of live cells. (C) CCK-8 analysis. (D) LDH release.
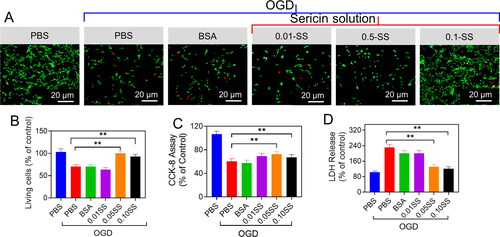
Figure 9. Neuroprotective properties of the sericin oxygen-glucose deprivation (OGD) injury. (A) The neurons treated with PBS, BSA and the Gen-SH degraded derivatives (SD) Live and Dead staining. (B) Quantifications of the ratio of live cells. (C) CCK-8 analysis. (D) LDH release. (E and F) Respective Bax/Bcl-2 mRNA level.
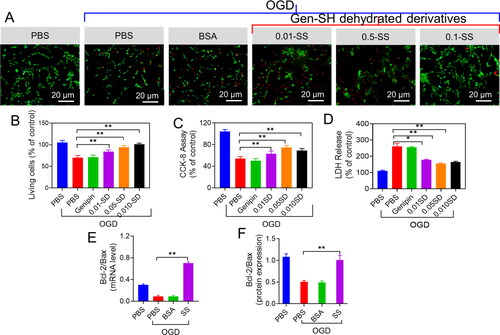
Figure 10. (A) Percentage of axon branches and length of the neurons. (B and C) The mRNA genes levels of Lkb1 and Nuak1 in the primary neurons 48 hrs after the revealed treatments. (D) The axon length of the primary neurons’ treatments with WZ4003 or DMSO.
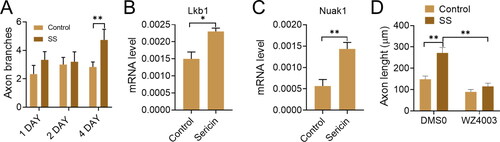
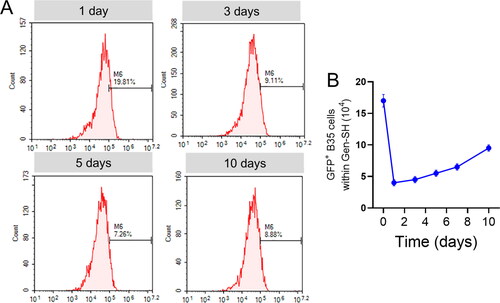
Figure 11. (A) The flow cytometry analysis of the viability of GFP-positive cells within the Gen-SH isolated from the transplanted area. (B) Percentage of the total numbers of GFP-positive cells within the Gen-SH isolated from the transplanted area.