
Figures & data
Figure 1. SEM Images of (a) NiO-ZnO, (b) Na alg/NiO-ZnO, and (c) pure sodium alginate (hydrogel) for lower resolutions and (a′), (b′) and (c′) for higher resolutions respectively.
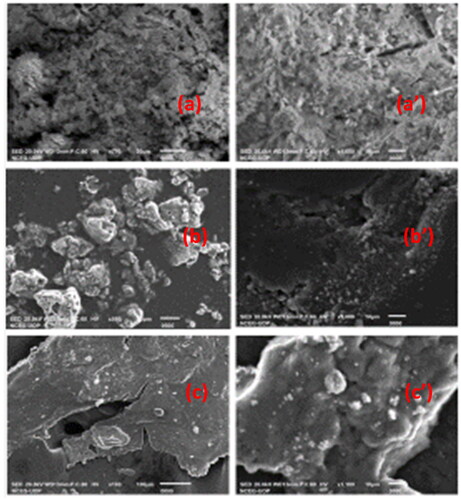
Figure 2. EDS Spectra of (a) NiO-ZnO, (b) Na alg/NiO-ZnO, and (c) pure sodium alginate polymer.
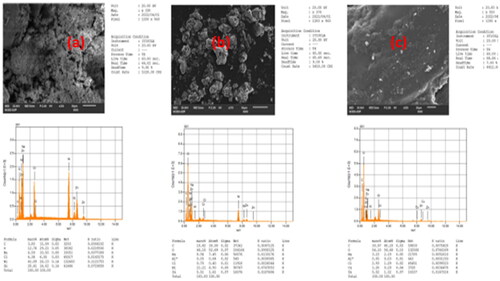
Figure 3. An FTIR spectrum depicts the absorption bands for NiO-ZnO (in grey) and Na Alg/NiO-ZnO nanocomposite (in red).
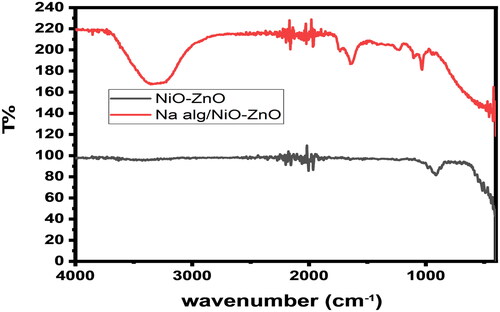
Figure 4. XRD Spectra of NiO-ZnO (a) (left) and pure alginate hydrogel (b) (right).
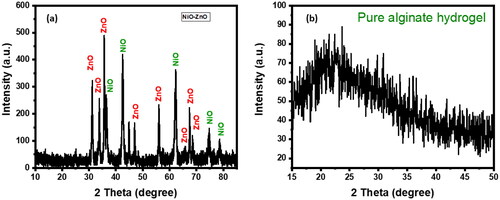
Figure 5. This scheme describes the photodegradation mechanism for organic contaminants.
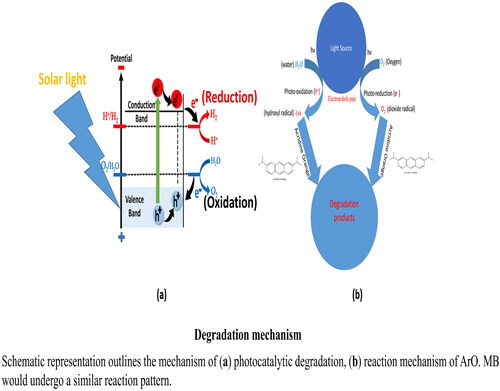
Figure 6. UV-Visible absorption spectra of photo-oxidation reaction for the selectivity between two organic dyes, (b) for ArO and (c) for MB. Graph (a) compares the photo-catalytic degradation efficiency of the two dyes with time.
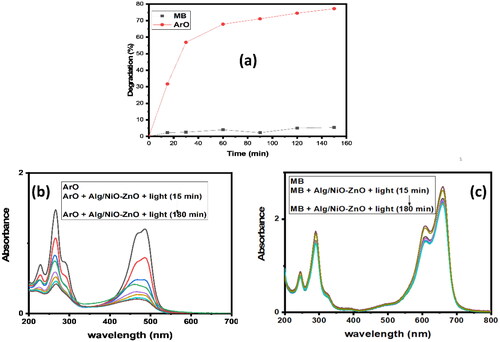
Figure 7. UV-Visible absorption spectra show the different amounts of the catalyst that are being used. (a) compares the photo-degradation efficiencies of the three amounts, while (b), (c), and (d) for the catalyst amounts 30, 20, and 10 mg respectively.
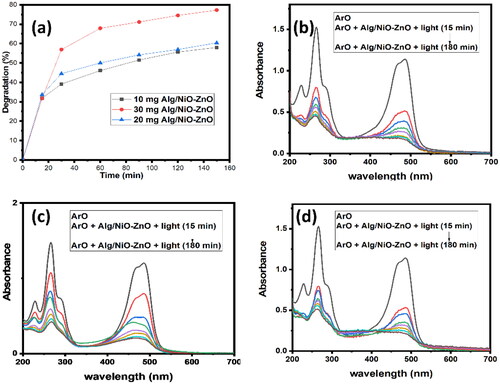
Figure 8. UV-Visible absorption spectra for the reusability of the nano-catalyst. Graph (a) shows the reusability of the catalyst in the degradation of ArO for two successive cycles.
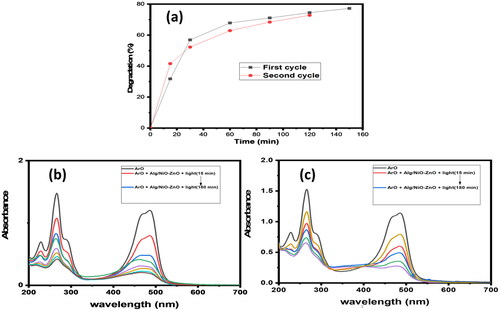
Figure 9. ESI mass spectra of the N-de-methylated intermediates that were isolated using the HPLC-ESI-MS method and produced during the photodegradation of the AO dye ( is regenerated from a paper published by Lu C, catalysts 2013).
Abbreviations:
ESI-MS = electrospray ionization mass spectrometry, HPLC = high performance liquid chromatography, AO or ArO = acridine orange dye, AO-M = N-de-monomethyl acridine orange, AO-MM = N,N′-de-dimethyl acridine orange, AO-D = N,N-de-dimethyl acridine orange, AO-DM = N,N,N′-de-trimethyl acridine orange, AO-DD = N,N,N′,N′-de-tetramethyl acridine orange.
A total of 6 compounds (including AO) have been detected, all of which are derived from the parent AO.
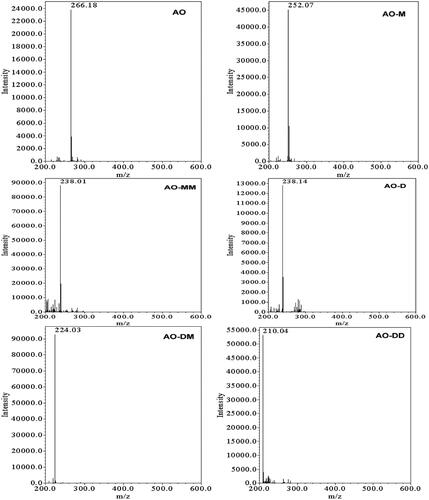
Figure 10. Schematic representation outlines the decolorization process of MB in presence of sodium borohydride using the Na alg/NiO-ZnO nanocomposite as a catalyst.
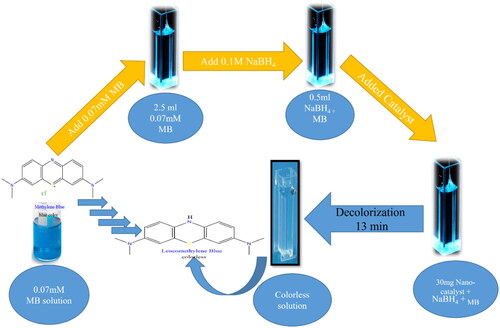
Figure 11. This graph outlines selectivity upon reduction (%R) as a function of time of four contaminants 4-NP, AO, MB, and MO.
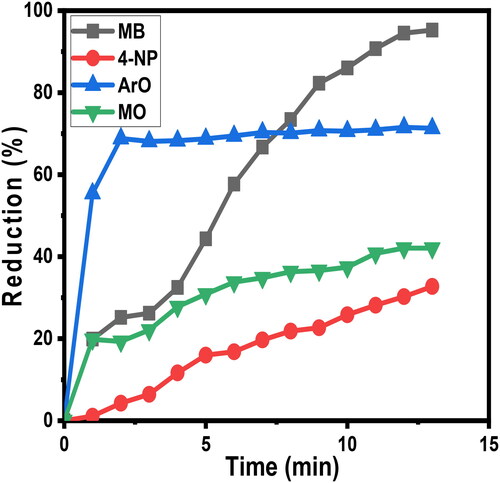
Figure 12. UV-Visible absorption spectra explain the selectivity upon four different organic dyes. These graphs (a), (b), (c) and (d) for UV-Visible spectra of MB, MO, 4-NP and ArO respectively.
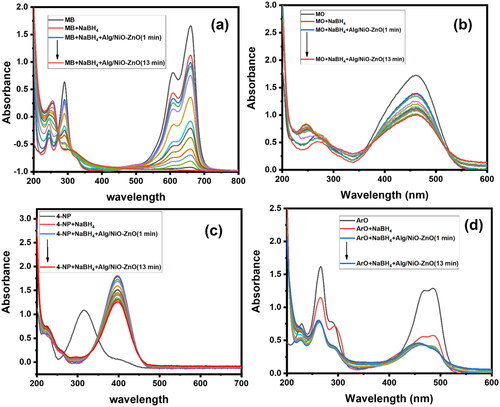
Figure 13. UV-Visible absorption spectra show different amounts of the catalyst (10 mg graph (c), 20 mg graph (b), and 30 mg graph (a)) that were being used during the reduction of MB. Graph (d) compares the reduction efficiencies in graphs (a-c).
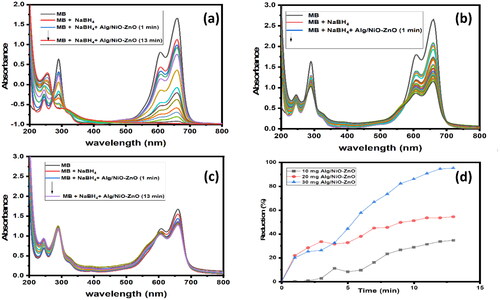
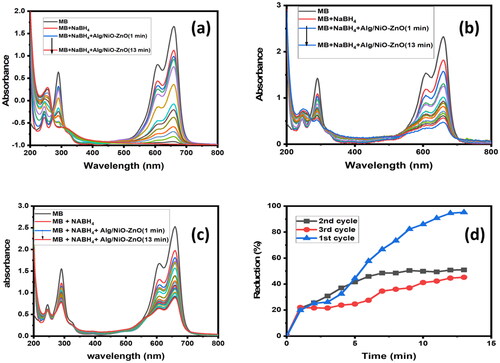
Figure 14. UV-Visible absorption spectra illustrate the recyclability of Na alg/NiO-ZnO as a catalyst for the reduction of MB (three cycles namely (a) first cycle, (b) second cycle, and (c) third cycle). Graph (d) compares the removal efficiencies of the three cycles.
Data availability statement
Not applicable