1,185
Views
0
CrossRef citations to date
0
Altmetric
Review

Another string to your bow: machine learning prediction of the pharmacokinetic properties of small molecules

, , & ORCID Icon
Pages 683-698 | Received 23 Oct 2023, Accepted 23 Apr 2024, Published online: 10 May 2024

Figures & data

Figure 1. Three archetypes of methods for PK parameter prediction, and visual presentations of selected PK parameters. Panel A: graphical representation of the three archetypal methods for PK property prediction: machine learning (ML), in vitro-in vivo extrapolation (IVIVE), and physiologically based PK (PBPK) modeling. Panels B-E: graphical representations of selected PK parameters that are of common interest. See for definitions and explanations. Panel a was created with BioRender.com. Panels B-E were made by JD Zhang and released under GNU public license. The source code and the figure can be found at https://github.com/Accio/2024-02-PK-parameters-visualized. JD Zhang explicitly authorizes the use of his work for this review.

Figure 1. Three archetypes of methods for PK parameter prediction, and visual presentations of selected PK parameters. Panel A: graphical representation of the three archetypal methods for PK property prediction: machine learning (ML), in vitro-in vivo extrapolation (IVIVE), and physiologically based PK (PBPK) modeling. Panels B-E: graphical representations of selected PK parameters that are of common interest. See Table 1 for definitions and explanations. Panel a was created with BioRender.com. Panels B-E were made by JD Zhang and released under GNU public license. The source code and the figure can be found at https://github.com/Accio/2024-02-PK-parameters-visualized. JD Zhang explicitly authorizes the use of his work for this review.

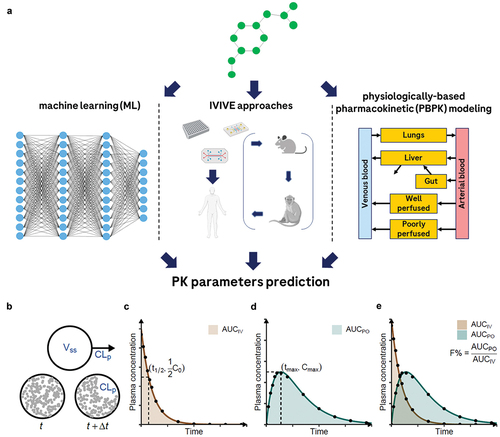
Table 1. Selected PK parameters obtainable through a single-dose PK experiment.

Figure 2. Relationship between ADME processes in vivo (a), compound’s ADME properties (b), and selected in vitro assays available to assess ADME properties (c). The in vivo outcomes are typically governed by multiple ADME compound properties. Many in vitro experiments are available to measure these properties, including physicochemical, biochemical, and cellular assays. in vitro assays can be used to deconvolute observed ADME processes or to predict ADME properties prospectively.

Figure 2. Relationship between ADME processes in vivo (a), compound’s ADME properties (b), and selected in vitro assays available to assess ADME properties (c). The in vivo outcomes are typically governed by multiple ADME compound properties. Many in vitro experiments are available to measure these properties, including physicochemical, biochemical, and cellular assays. in vitro assays can be used to deconvolute observed ADME processes or to predict ADME properties prospectively.

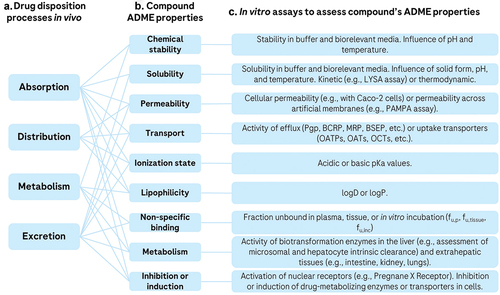
Table 2. Advantages and potential limitations of ADME assays as predictors of drug disposition in vivo and tools for rational drug design, as well as possible mitigation measures.

Figure 3. Evolution of machine-learning models for PK parameter prediction. The panels illustrate key parameters of ML models, including the year of publication (x-axis) and performance metrics (y-axis), species of predictions (colors), number of compounds used (size of the bubbles), and root-mean-square errors (RMSE) indicated as numbers near the bubbles. In cases RMSE values are not available, NA (not available) is indicated. Panel a, c, and e visualize models reviewed that predict Vss, CLp, and bioavailability, respectively, using AAFE (absolute average fold error), which is also known as Geometric mean Fold error (GMFE), as the metric of performance. Panel b, d, and f show models that predict the same properties as panel a, c, and e, however using coefficients of determination (R2) as the metric. Some studies only report either AAFE or R2 but not the other, therefore the studies included in pairs of panels for the same property (for instance panel a and c for Vss prediction) overlap only partially. Red dashed lines indicate boundary conditions at which an ideal model that makes perfect predictions would perform: an AAFE of 1.0 or an R2 of 1.0.

Figure 3. Evolution of machine-learning models for PK parameter prediction. The panels illustrate key parameters of ML models, including the year of publication (x-axis) and performance metrics (y-axis), species of predictions (colors), number of compounds used (size of the bubbles), and root-mean-square errors (RMSE) indicated as numbers near the bubbles. In cases RMSE values are not available, NA (not available) is indicated. Panel a, c, and e visualize models reviewed that predict Vss, CLp, and bioavailability, respectively, using AAFE (absolute average fold error), which is also known as Geometric mean Fold error (GMFE), as the metric of performance. Panel b, d, and f show models that predict the same properties as panel a, c, and e, however using coefficients of determination (R2) as the metric. Some studies only report either AAFE or R2 but not the other, therefore the studies included in pairs of panels for the same property (for instance panel a and c for Vss prediction) overlap only partially. Red dashed lines indicate boundary conditions at which an ideal model that makes perfect predictions would perform: an AAFE of 1.0 or an R2 of 1.0.

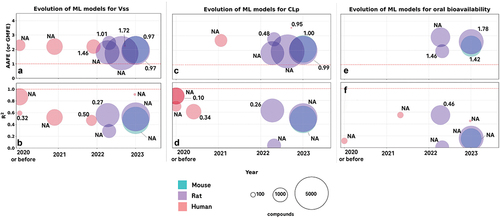
Table 3. Overview of the three approaches for PK predictions.

Supplemental material

SupplementaryTable2_Literature_ML_for_ADME_and_PK.xlsx

Download MS Excel (93.9 KB)

Davide_PK_review_20240422 - Supplementary Document.docx

Download MS Word (521.8 KB)