Figures & data
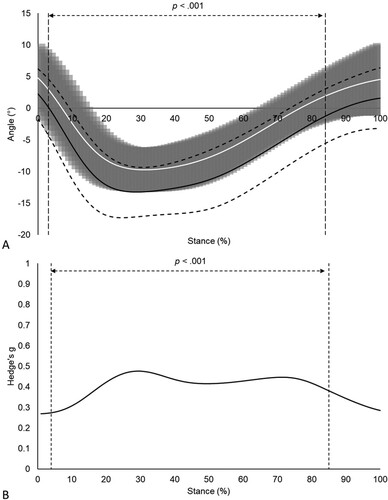
Figure 1. (A) Magnitude of fatigue related change in frontal plane RF motion for cluster 1 (mean: solid white line; SD: dark grey shaded region) and cluster 2 (mean: solid black line; SD: light grey shaded region), with positive and negative values denoting more inverted and everted positions post-fatigue respectively, and (B) Hedge’s g effect size comparing the magnitude of fatigue related change between clusters. Vertical dashed lines denote the beginning and end of the period of statistical significance as identified by SPM independent samples t-tests (p < .001).
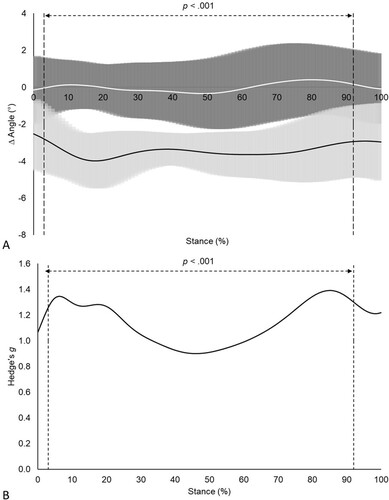
Figure 2. (A) Frontal plane RF kinematics pre- (mean = solid white line; ± 1 SD = shaded grey region) and post-fatigue (mean = solid black line; ± 1 SD = dashed black lines), (B) and associated effect sizes for cluster 1 (n = 9).
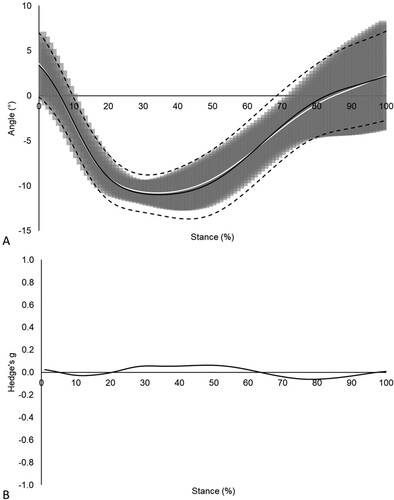
Figure 3. (A) Frontal plane RF kinematics pre- (mean = solid white line; ± 1 SD = shaded grey region) and post-fatigue (mean = solid black line; ± 1 SD = dashed black lines), (B) and associated effect sizes for cluster 2 (n = 7). Vertical dashed lines denote the beginning and end of the period of statistical significance as identified by SPM independent samples t-tests (p < .001).