Figures & data
Figure 1 A shcematic representation of a sample trial Experiment 1. Two coloured RDKs, moving coherently in different direction of motion were presented simultaneously. In 1/3 of the trials, probe display was presented after a long retention period. In the remaining 2/3 of the trials, a visual search task of varied difficulty (low vs. high load) was presented before the presentation of the probe display. Participants were asked to respond as fast as they can and as accurately as they can to the visual search task and were asked to adjust the orientation of the response stimuli to the direction of motion of the RDK with similar colour.
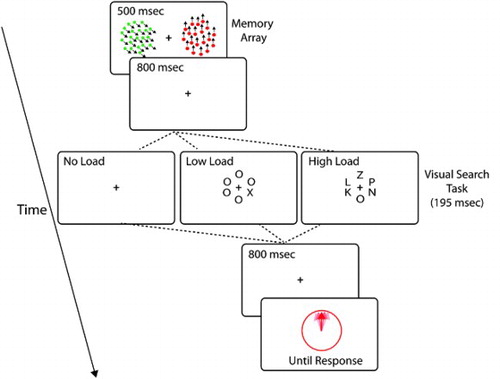
Figure 2 Three sources of error in memory used for modeling performance. (A) A Von Mises (circular Gaussian) distribution with concentration parameter κ, centred on the target value, capturing variability in memory for target, with the area under the distribution (shaded) being proportional to the probability of responding to the target; (B) Von Mises distribution with concentration parameter κ, centred on one of the non-target value, resulting from errors in identifying which target value belonged with the target colour (misbinding). The area under the distribution corresponds to the proportion of non-target responses and (C) A uniform distribution of error corresponding to random error, with the area under this distribution corresponding to the proportion of random responses.
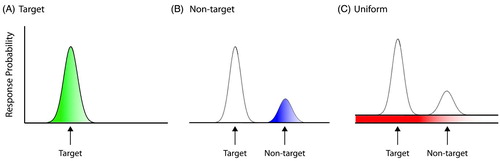
Figure 3 Distribution of errors relative to target and non-target motion direction, Experiment 1. (A) Frequency of response as a function of the difference between the response and the target motion direction. Under high load condition, the variability in recall of the target direction (width of the distribution) increase and the peak of the distribution centred around target value (zero) decreases. (B) Frequency of response as a function of the difference between the response and the non-target motion direction. There is a larger proportion of responses around the non-target direction under high load condition compared to the other two conditions. Error bars indicate SEM (N = 12).
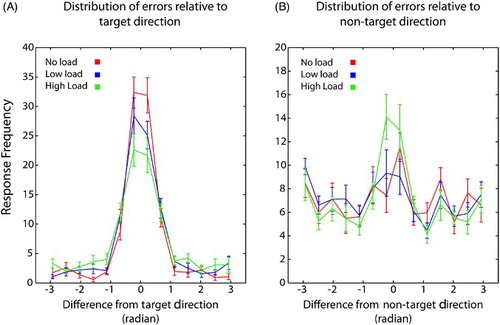
Figure 4 Model estimates for different sources of error in the visual working memory task for different search conditions, Experiment 1. (A) Concentration parameter did not differ significantly between different visual search conditions. (B) Probability of target responses (p(T)) decreased significantly under visual search conditions compared to no search condition. Probability of target responses (p(NT) increased significantly under high load condition compared to no load and low load conditions and probability of random responses (p(U)) did not differ significantly between different conditions. Error bars indicate SEM (*p < .05, **p < .01).
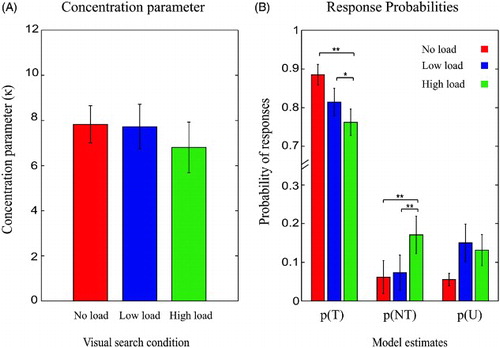
Table 1. Model estimates under different visual search conditions in Experiment 2
Figure 5 Distribution of errors relative to target and non-target directions in Experiment 3. (A) Frequency of response as a function of the difference between the response and the target direction. As visual search difficulty increased, the variability in recall (width of the distribution) around the target direction increased and the peak of distribution decreased. (B) Frequency of responses as a function of the difference between the response and the non-target direction. There is an increase in proportion of non-target responses as visual search difficulty increased from no load to hyper load conditions. Error bars indicate SEM.
Table 2. Model estimates under different visual search conditions in Experiment 3
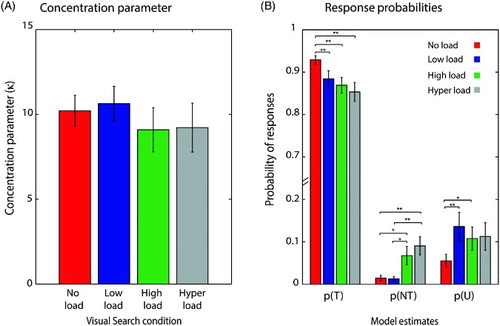
Figure 6 Model estimates for different sources of error in the visual working memory task for different search conditions in Experiment 3. (A) Concentration parameter did not differ significantly between different visual search conditions. (B) Probability of target responses (p(T)) decreased significantly under visual search conditions compared to no search condition. Probability of target responses (p(NT) increased significantly under high and hyper load condition compared to no load and low load conditions and probability of random responses (p(U)) increased significantly under low and high load conditions compared to no load condition only. Error bars indicate SEM (*p < .05, **p < .01).