Figures & data
Table 1. Demographic and defining characteristics of the 44 dyslexics and 40 controls
Table 2. Performance of the group of the 44 dyslexics and 40 matched controls on phonological processing and lexical learning tasks
Table 3. Performance of the dyslexics and matched controls on visuospatial memory tasks
Figure 1 Percentages of different types of errors (over total errors) made in the written learning paired-associate task by dyslexic and control participants. (a) General error types. (b) Types of single letter errors.
Table 4. Performance of the 44 dyslexics and 40 matched controls on the order-reconstruction and recognition conditions of the Hindi and Japanese tasks
Figure 2 Serial position curves in the Hindi and Japanese order reconstruction task by condition and group of participants. (a) Simultaneous condition. (b) Sequential condition.
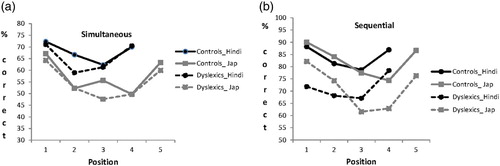
Table 5. Pearson two-tailed correlations partialling out age
Table 6. Results of binary logistic regressions predicting the classification of our participants to the dyslexic and control groups
Figure A1 Examples of Hindi and Japanese characters used for the order reconstruction and recognition tasks.