
Figures & data
Figure 1. Schematic illustration of the events in three conditions of implicit and explicit false belief tasks (FBT).
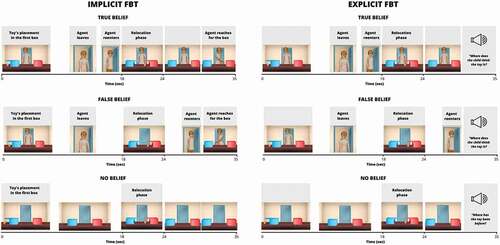
Figure 2. The localization of a priori ROIs (L – left, R – right): inferior parietal lobule (IPL), posterior temporoparietal junction (TPJp), anterior temporoparietal junction (TPJa), posterior middle temporal gyrus (pMTG), middle temporal cluster (MiddTemp), anterior temporal cluster (AntTemp), inferior frontal cluster (InfFront), ventral medial prefrontal cortex (vmPFC), dorsal medial prefrontal cortex (dmPFC), pre-supplementary motor area (preSMA), precuneus.
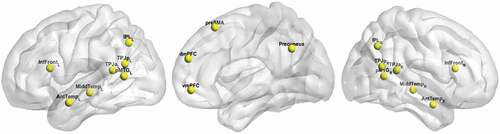
Table 1. Summary of the behavioral results.
Figure 3. Results of whole-brain analysis. The figure presents active areas for the following contrasts: implicit and explicit FBT: FB-change-of-location > NB-change-of-location; SOPIT: Interaction > scrambled motion; HCP soc task > mentalizing > random; FB localizer: belief > photo. FWEc correction at the p < .05 level of significance, cluster-forming threshold p < .001.
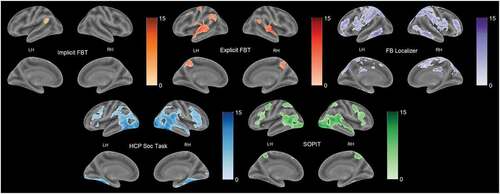
Figure 4. The model and the average representational similarity matrices (RSMs) for ROIs. Panel a depicts a planned model of similarity of neural response patterns between the two groups of tasks (Implicite FBT, explicite FBT and FB localizer are grouped as belief-reasoning tasks whereas SOPIT and HPC soc task as decoding of intentions from motion kinematics). Panel B shows the average representational similarity matrices (RSMs) for the ROIs in which the model was significantly correlated with the activity patterns (Bonferroni corrected, p < .05). Scale represents degree of similarity between categories.
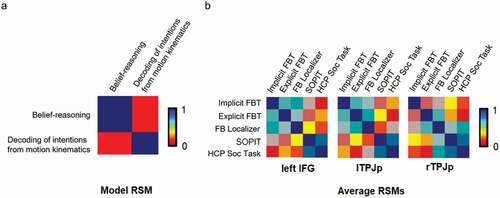
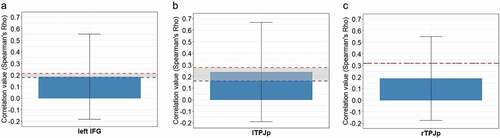
Figure 5. (a-c). Significant correlations between the model and activity patterns in the ROIs (Bonferroni corrected, p < .05). The red and blue dashed lines illustrate upper and lower bounds of the noise ceiling respectively.
SNS-RP_30.22_Supplementary_Material_Clean.docx
Download MS Word (64.8 KB)Data availability statement
The datasets generated for this study are available upon request from the corresponding author.