Figures & data
Figure 1. Cross-sectional imaging signs of active disease. i) Conventional B-mode ultrasound of the terminal ileum, including normal mural thickness (≤3 mm), mural stratification and mesentery. ii) Active disease on IUS showing disruption of mural stratification, particularly at the mesenteric border which is blurred (arrowhead). There is bowel wall thickening, including of the submucosa where there is patchy hypoechogenicity. There is also mesenteric inflammation, represented by marked mesenteric expansion (double headed arrow). Linear mural defects with gas are in keeping with deep ulceration (arrow), a sign of more severe inflammation. iii) Intestinal ultrasound image showing hypervascularity of the terminal ileum manifest as increased color Doppler signal. Note the other signs of active disease; bowel wall thickening, edema (with patchy changes in the submucosa, in contrast to i) where it is uniformly echogenic), deep ulceration (arrow), blurring of the bowel mesenteric border (arrowhead) and mesenteric expansion (double headed arrow). iv) Coronal T2-weighted MRE image showing a long segment of severely active disease involving the distal jejunum and proximal ileum (arrowheads). There is bowel wall thickening and edema, in addition to perimural free fluid, also collecting in the right iliac fossa (asterisk). Additionally, there is chronic disease of the more distal ileum (arrows) which appears damaged with multiple pseudosacculations and likely fibrotic predominant strictures. v) Axial fat-saturated T2-weighted imaging better depicts mural and perimural edema. There is severe active disease in a loop of terminal and distal ileum (arrows) with high T2 signal in part reflecting marked mural and perimural edema, including linear high signal extending into the mesentery. vi) Axial post-contrast image showing mural hyperenhancement, particularly mucosal, and engorgement of the vasa recta supplying the inflamed terminal ileal loop (arrows); the comb sign.
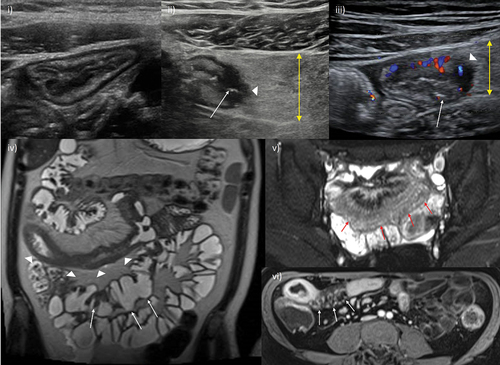
Table 1. Magnetic resonance enterography-based activity scores: summary of scores including their derivation.
Table 2. Intestinal ultrasound-based activity scores: summary of more commonly used scores.
Table 3. Transmural healing: cross-sectional imaging criteria used in recent studies, rates of transmural healing achieved and clinical outcomes.
Figure 2. Transmural healing. A 15-year-old male patient with newly diagnosed Crohn’s disease. At baseline, MRE showed moderately active disease involving the terminal and distal ileum (i) axial fat-saturated T2-weighted MRI image showing terminal ileal mural thickening and increased mural T2 signal (arrow), and mesenteric free fluid mainly in the right iliac fossa, ii) corresponding high signal on diffusion weighted images with enlarged reactive mesenteric nodes (arrows). iii) Baseline ileocolonoscopy documented a simple endoscopic score (SES-CD) of 15 iv) after 6 months of infliximab and methotrexate therapy ultrasound fulfilled the criteria for true transmural healing with normal mural thickness (≤3 mm) and stratification, and complete resolution of mesenteric changes. Small bowel motility was subjectively normal. Axial fat-saturated MRE image confirmed transmural healing of the terminal ileum (arrow) was maintained at 12 months (v), and at again at 18 months on IUS (vi). MRI: Magnetic resonance imaging; MRE: MR enterography; IUS: intestinal ultrasound.
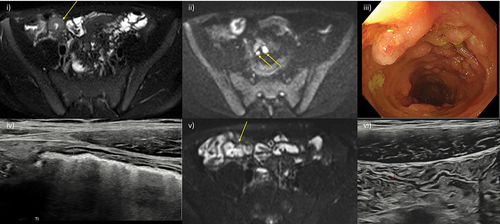
Figure 3. Imaging and quantifying fibrosis. i) Axial T2-weighted image of the pelvis demonstrating a long stricture of the terminal ileum (arrow). ii) Corresponding magnetization transfer imaging of the stricture alongside a quantitative color scale shows decreased magnetization transfer ratio (MTR) in the wall of this segment with a range of 20 to 60.
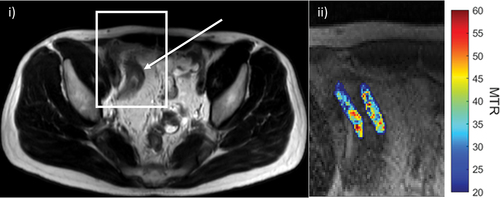
Figure 4. Mesenteric fat wrapping. A 29-year-old female Crohn’s disease patient with signs of extensive fat wrapping of the terminal ileum. i) IUS with mesenteric fat wrapping involving most of the small bowel circumference and displacing a loop of ileum (arrow). ii) Comparable axial T2-weighted MRE image, also showing resultant separation of the terminal ileum from other loops of pelvic ileum (arrow). MRE also demonstrates terminal ileal stricturing disease with reduced luminal caliber and mild pre-stenotic dilation (asterisk).
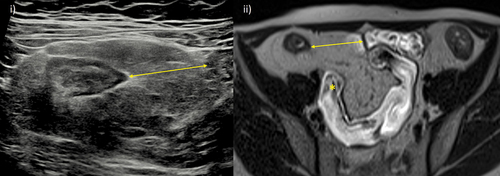
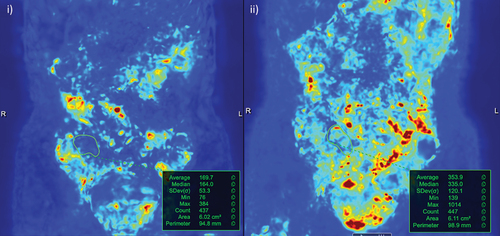
Figure 5. Software assisted quantification of motility. i) Pre-treatment motility map of active terminal ileal disease (region of interest drawn based on a reference image) with an average motility value of 170. ii) After 8 weeks on treatment, disease in the terminal ileum responded clinically and based on MRE parameters of activity. This included a measurable improvement in motility; average of 354.