Figures & data
Figure 1. Examples of selection locations within the un-edged boards for parallel and perpendicular to grain test specimens, with and without knots (left). Cross-section view with definitions of growth characteristics, distance to pith and growth-ring angle
(right). Specimen length l, width w and thickness t.
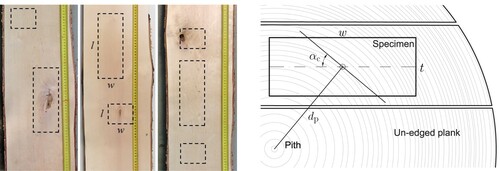
Table 1. Test specimens and specifications of the compression tests.
Table 2. Documented growth characteristics and knot parameters.
Figure 2. Example of digital image correlation contrast pattern applied on the surface of a specimen.
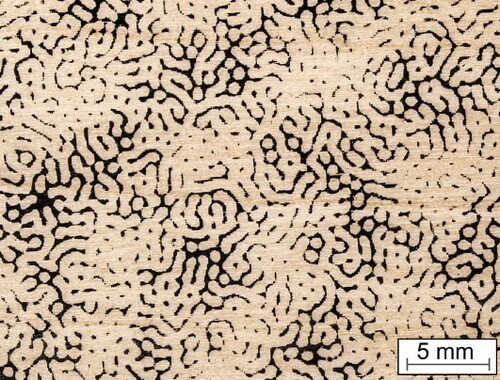
Figure 3. Compression strength parallel to grain vs. stiffness
, density ρ and knot volume
(left). Compression strength perpendicular to grain
vs. stiffness
, density ρ and knot volume
(right).
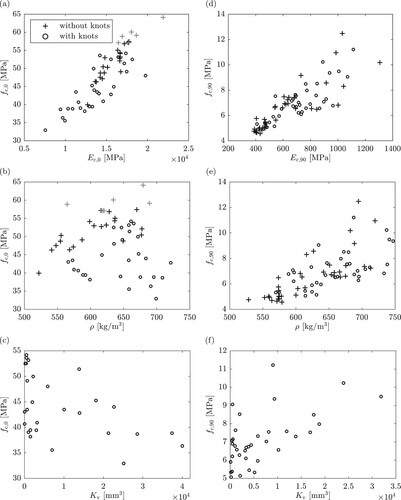
Table 3. Mean mechanical properties [MPa] and correlation coefficients between mechanical properties.
Table 4. Correlation coefficients between knot free specimens and mechanical properties.
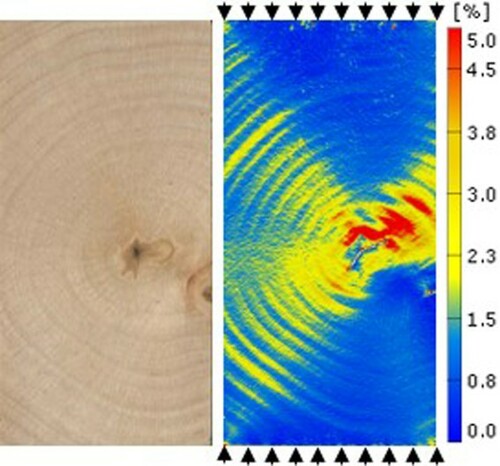
Figure 4. Structural timber specimen with knot under compression loads parallel to grain. Equivalent strain images are shown at (a) maximum load, 158 kN ( MPa); and (b) after failure at a load of 130 kN (
MPa).
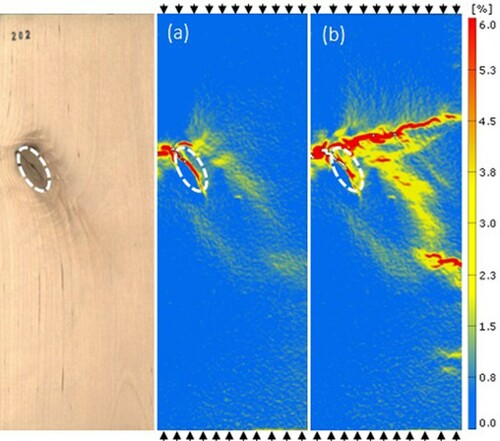
Figure 5. Face view of a specimen with knot in compression loads perpendicular to grain. Equivalent strains are shown at maximum load, 22 kN ( MPa).
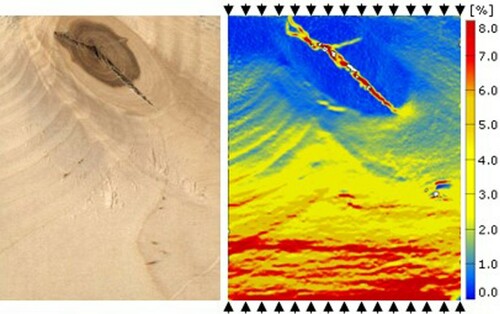
Figure 6. Cross-section view of a specimen without knot under compression loads perpendicular to grain. Equivalent strains are shown at maximum load, 18 kN ( MPa).