
Figures & data
Figure 1. Illustration of the explored synergies between engineering design and carbon footprint of CLT building.
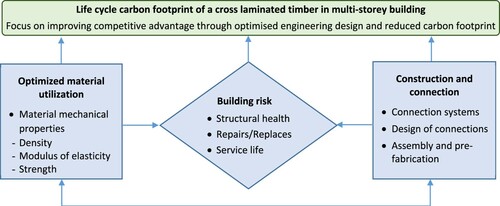
Figure 2. Illustrations of the west facade and a floor plan of the studied CLT multi-storey building.
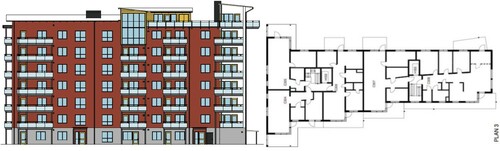
Figure 3. Schematic representation of the different CLT walls [(a) exterior wall, (b) apartment separating wall, (c) other interior load bearing wall (within apartment)] and floor constructions of the studied building.
![Figure 3. Schematic representation of the different CLT walls [(a) exterior wall, (b) apartment separating wall, (c) other interior load bearing wall (within apartment)] and floor constructions of the studied building.](/cms/asset/acb58d7f-673e-4675-a4a5-161862a35e53/swoo_a_1974937_f0003_oc.jpg)
Table 1. Mass of CLT in different parts of the studied CLT multi-storey building.
Figure 4. System boundary of activities in the study. The dash borders show what is covered in the analysis.
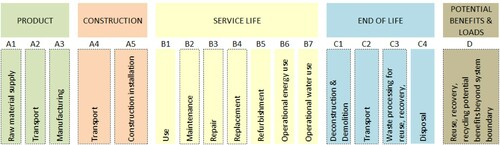
Table 2. Structural engineering aspects and their implications for the life cycle carbon footprint modelling.
Figure 5. Material production (A1–3) carbon footprint for the reference building.
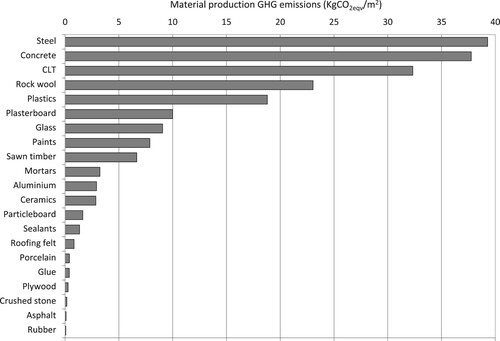
Figure 6. Relative distributions of materials of the reference building in terms of mass and carbon footprint.
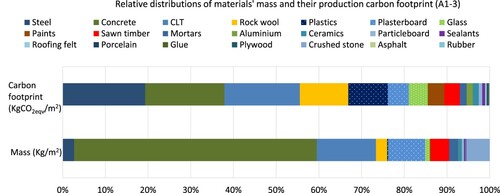
Table 3. Material production carbon footprint (kgCO2eqv/m2) broken into CLT and non-CLT structural components.
Table 4. Reductions of carbon footprint for the structural engineering aspects compared to the building in the reference case. Negative values denote increased benefit, while positive values denote reduced benefit.
Figure 7. Relative distribution and net balance of the carbon footprint for the reference building and the synergy effect of structural engineering design.
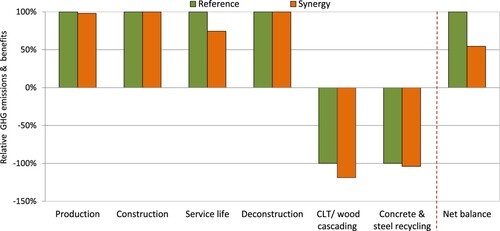
Table 5. Carbon footprint and life cycle GHG balances for the reference building and the synergy effect of structural engineering design.
Table A1. Quantities of inventoried materials (air-dry) contained in the reference building and data sources for the life cycle inventories analysis. RER and CH are short names for Europe and Switzerland in Ecoinvent.