Figures & data
Table 1. Definitions of assistive products, assistive technology systems and social exclusion.
Table 2. Defining and differentiating policies, strategies and action plans.
Figure 1. Components of the policy process (reproduced by permission [Citation21]).
![Figure 1. Components of the policy process (reproduced by permission [Citation21]).](/cms/asset/3d42fb4b-8f93-4aeb-bb19-088ac14ead9a/iidt_a_1468496_f0001_c.jpg)
Figure 2. A schematic representation of Assistive Technology System gaps. 1Note this bar chart is not to scale – globally the number of assistive products needed far exceeds those available; sometimes by a ratio of 10 or more to one, and this is patterned by socioeconomic factors, marginalization and so on.
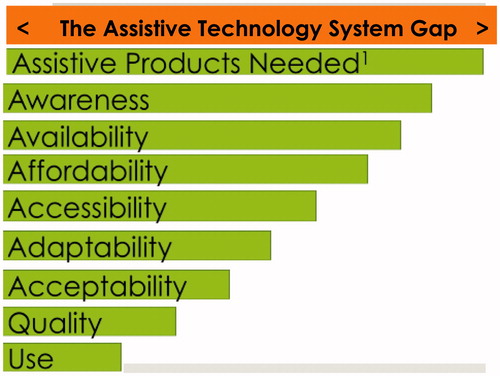
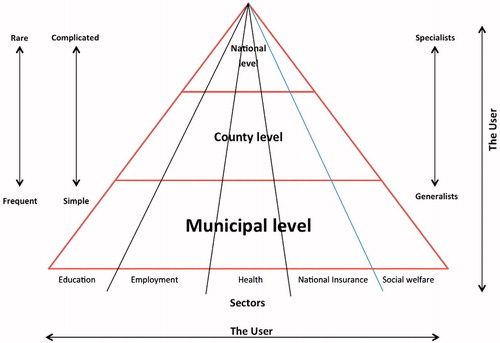
Table 3. Some attributes of the Norwegian Assistive Technology System (see [Citation26]).
Table 4. Possible elements of, facilitators for and barriers to, the development of national assistive technology policies.
Figure 3. The Norwegian Assistive Technology System model: 18 Assistive Technology Centres, one in each county, cooperate closely with the health care and rehabilitation services at the municipal level.