
Figures & data
Table 1. Teacher demographics by grade level.
Table 2. Student demographics by grade level.
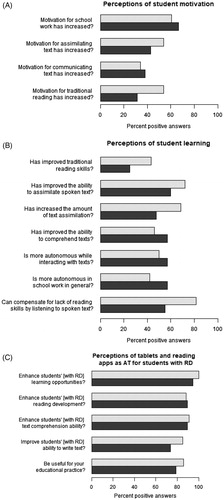
Figure 1. Percentage of teachers’ positive responses (nr. 4&5). Upper bar (light grey) represent Grade 4. Lower bar (grey) represent Grade 8 and High school.
Supplemental material