Figures & data
Figure 1. Sequence of activities in the case series.
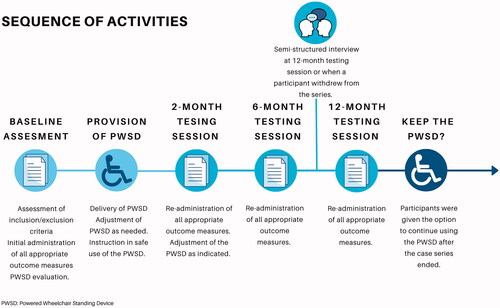
Table 1. Descriptions of outcome measures.
Figure 2. The powered wheelchair standing device in sitting and standing. The powered wheelchair standing device allows users access to the vertical plane.
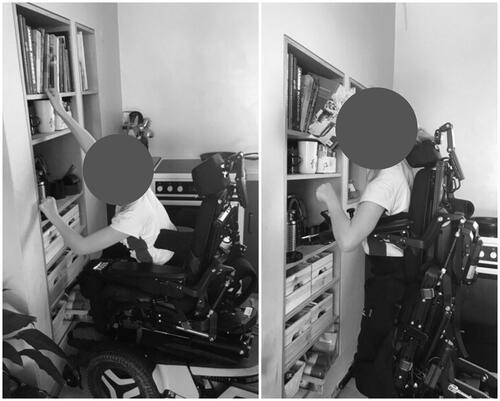
Table 2. Participant demographics at the onset of the case series.
Table 3. Canadian Occupational Performance Measure [Citation11,Citation12] ratings at 2, 6 and 12 months.
Figure 3. EQ-5D-Y health profile scores for participants <18 years of age. Lower scores indicate a better quality of life.
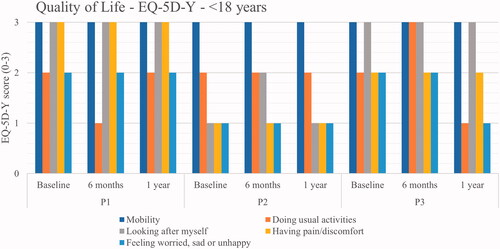
Table 4. EQ-VAS global assessment of health [Citation13, Citation14].
Figure 4. EQ-5D-5L health profile scores for participants <18 years of age. Lower scores indicate a better quality of life.
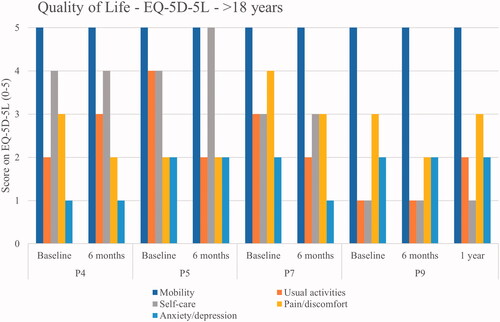
Table 5. Patient-Assessment of Constipation Quality of Life Questionnaire scores.
Figure 5. Changes in participants’ lower extremity passive range of motion from baseline.
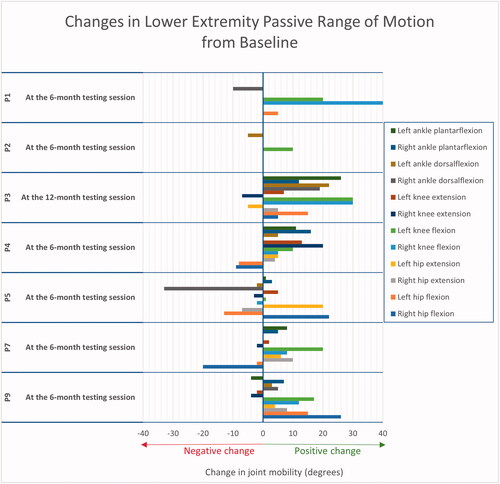
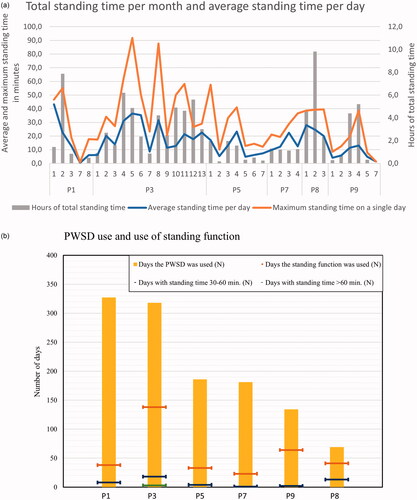
Figure 6. (a) Total standing time per month, average standing time per day, and maximum standing time during a single day.(b) Number of days of powered wheelchair standing device use and use of the standing feature. Permobil Connect data could not be analysed for participants 2 and 4.