
Figures & data
Table 1. Participants’ characteristics.
Table 2. Overview of the measurements.
Table 3. Procedural fidelity of the intervention.
Figure 1. Total words written. TWW: Total Words written. N4: test 9 is missing. None of the students chose TTS during the intervention’s first test since it was not introduced until session 4. Conditions of used assistive technology: A = STT, B = STT + TTS, C = STT + TTS + Spell-checker, D = STT + TTS + Spell-checker + Word prediction, E = STT + TTS + Word prediction, F = STT + Spell-checker + Word prediction. G = STT + Word prediction, H = STT + Spell-checker.
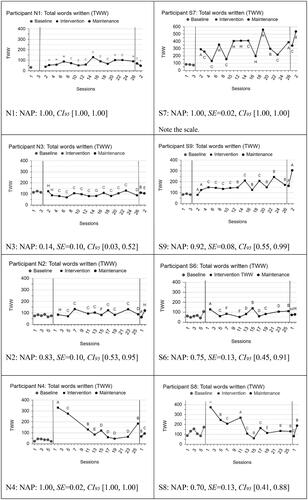
Figure 2. Percentage of misspelled words. WSW: Words spelled wrong. Words spelled correct, WSC index = WSC/TWW*100, Misspelled words: SUM(100 – WSC INDEX). N4: test 9 is missing.
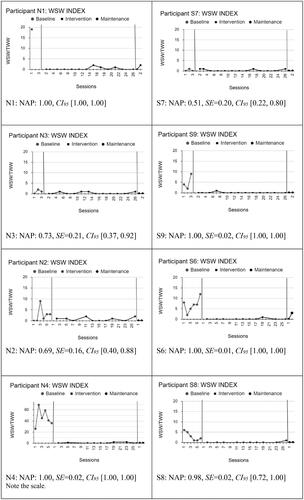
Figure 3. The percentage of correct written sequences of total words. CWS: Correct writing sequences. CWS index = CWS/TWW*100. N4: test 9 is missing.
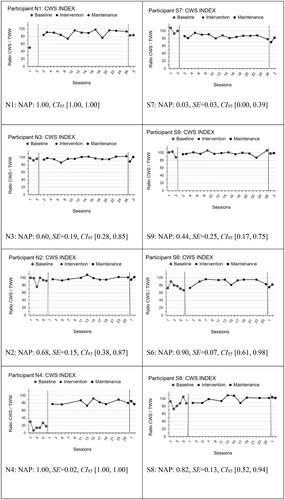
Figure 4. Number of sentences and average sentence length. The numbers in the graphs represent the sum of sentences according to the students’ punctuation marks. 1 = One paragraph text, with one or no punctuation.
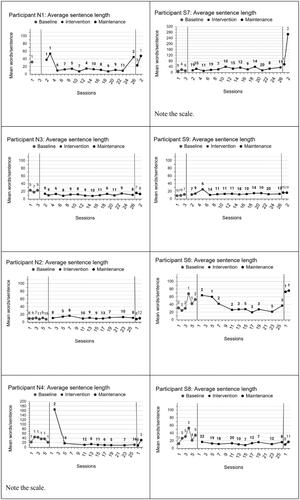
Figure 5. Vocabulary (VD index and WL index). VD: Vocabulary diversity; VD index: VD/•TWW; WL: Word length ≥ 7 letters; WL index: WL/•TWW. N4: test 9 is missing.
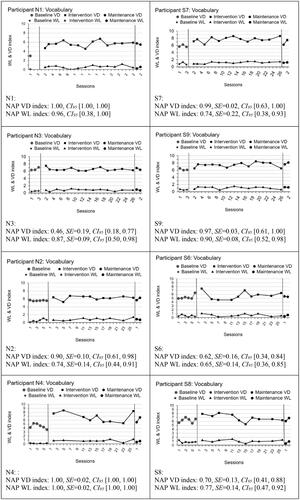
Table 4. AT Conditions during the intervention.
Table 5. Baseline results.
Table 6. Intervention results.