
Figures & data
Figure 1. Distribution of the DINGO Database pile test in the main subcategories. (Some geology categories are overlapping, i.e. a single pile may be in multiple categories.)
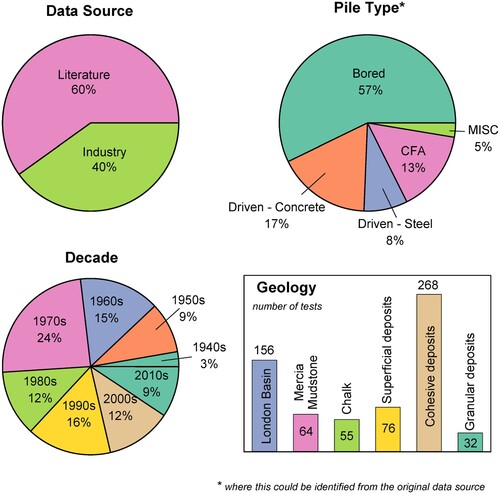
Figure 2. GIS geology map showing the geographic distribution of the DINGO Database tests for fine-grained deposits.
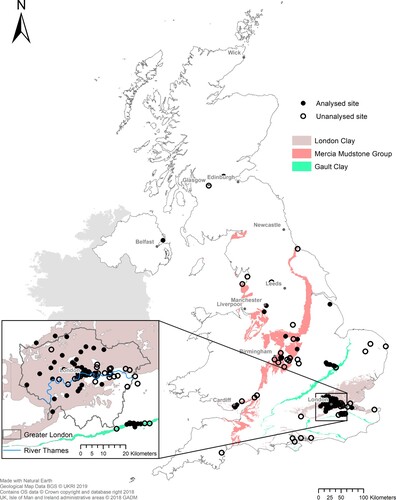
Figure 3. Summary of analytical solution for nonlinear pile settlement considering shearing of concentric cylinders around the pile, pile compression, and non-linear stress-strain relation (strength mobilisation function from Vardanega and Bolton Citation2011a), hereafter referred to as “Model 1” (see Vardanega, Williamson, and Bolton Citation2012a; Vardanega et al. Citation2018 for further details on the development of the model). Symbols are defined in the notation list.
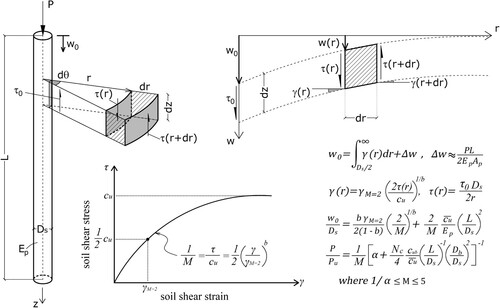
Figure 4. Summary of analytical solution for elastoplastic pile settlement considering elastic – perfectly plastic shaft resistance and bilinear tip resistance, hereafter referred to as “Model 2” (modified after Crispin, Leahy, and Mylonakis Citation2018, see also Voyagaki et al. Citation2019 for further details regarding Model 2). Symbols are defined in the notation list.
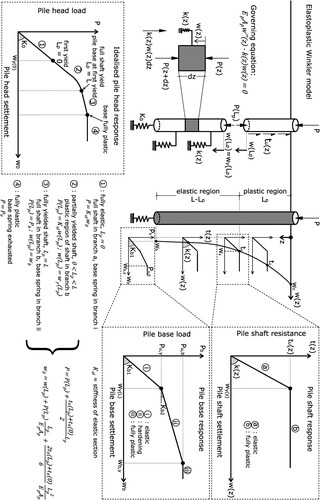
Table 1. Summary statistics of the DINGO pile test database included in this study.
Table 2. Key Model Parameters.
Table 3. Classification of the DINGO data set based on data quality category for the fine-grained soils subset (updated from Vardanega et al. Citation2021a).
Figure 5. Site R37-05, pile TP1 (a) Soil profile; (b) undrained shear strength variation with depth; and (c) model parameters derived from the soil investigation data for a database site classified as high quality (IV) and; (d) corresponding predicted load-settlement curves plotted against test data.
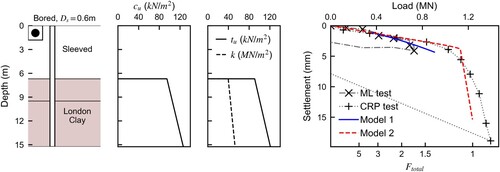
Figure 6. Site R24-01, pile P1(a) Soil profile; (b) undrained shear strength variation with depth; and (c) model parameters derived from the soil investigation data for a database site classified as low quality (I) and; (d) corresponding predicted load-settlement curves plotted against test data.
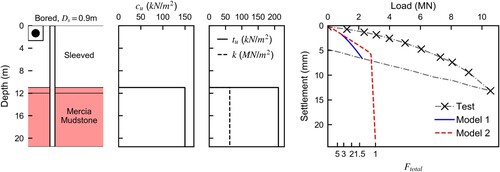
Figure 7. Predicted versus measured pile head settlement plot for the full set of data analysed in this study (model parameters from ).
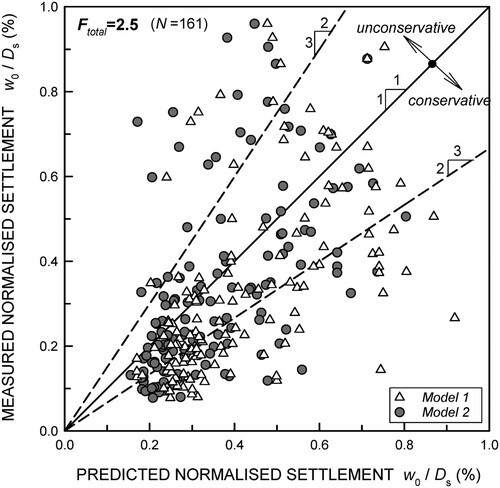
Figure 8. Predicted versus measured pile head settlement plot for different values of factors of safety for the full set of data analysed in this study (model parameters from ).
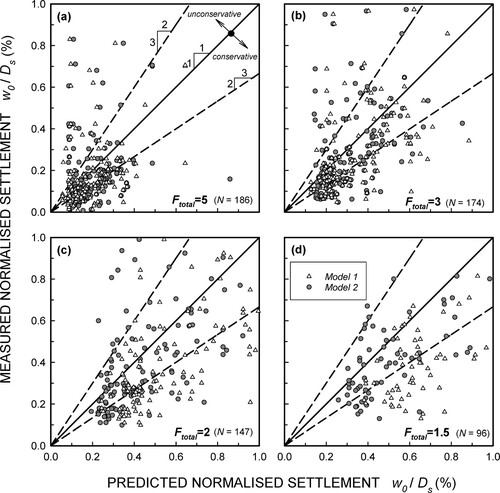
Figure 9. Predicted versus measured pile head settlement plot organised by soil parameter source (categories described in , model parameters from ).
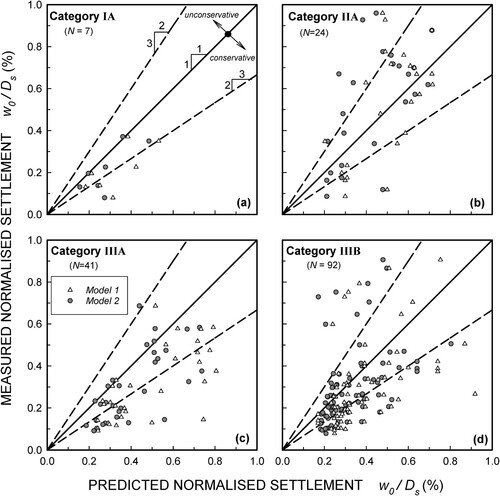
Figure 10. Predicted versus measured pile head settlement plot organised by geology category (parameters from ).
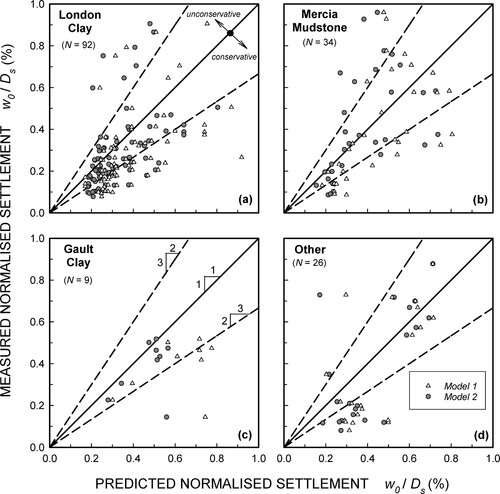
Figure 11. Predicted versus measured pile head settlement plot organised by epoch of the tests (parameters from ).
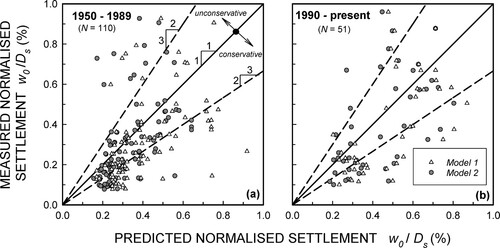
Figure 12. Predicted versus measured pile head settlement plot organised by construction method (parameters from ).
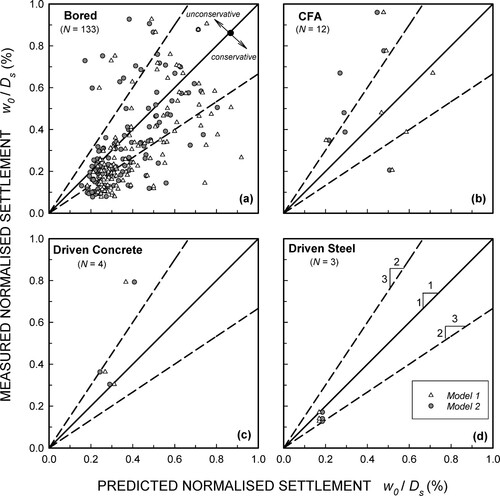
Figure 13. Predicted versus measured pile head settlement plot organised by slenderness of the test pile (parameters from ).
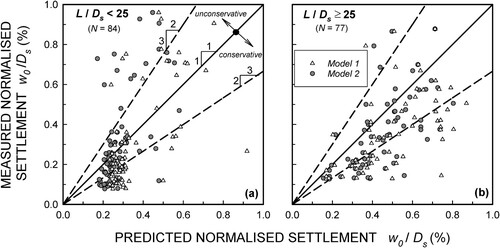
Figure 14. Predicted versus measured pile head settlement comparing Model 1 and Model 2 (parameters from ).
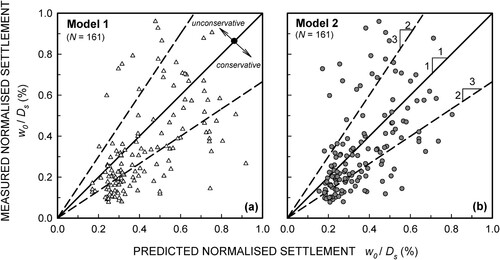
Table 4. Statistics of the model bias factors B (Equation 4) and model error presented in .
Table A1. Summary of 57 pile test sites from the DINGO Database analysed in this study (Geology codes are listed in DINGO Database (Vardanega et al. Citation2021b)).
NGRK-2020-0102-File021.pdf
Download PDF (3.5 MB)Data availability
The underlying data used for the analysis presented in this paper can be sourced from the DINGO database which can be freely downloaded from the data.bris repository via the following weblink: https://doi.org/10.5523/bris.89r3npvewel2ea8ttb67ku4d (Vardanega et al. Citation2021b).