
Figures & data
Figure 1. Example of a test item.
A graph showing an example of a test item where a participant has to indicate their familiarity with the expression ‘alma gemela’.
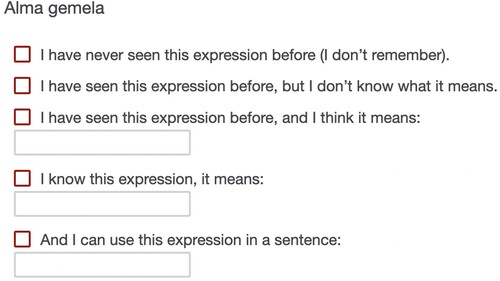
Table 1. VKS scoring procedure.
Table 2. Descriptive statistics of the pilot study (N = 6).
Table 3. Vocabulary Knowledge Scale descriptives for all 50 items: single (n = 39) and MWUs (n = 11).
Figure 2. Pretest and posttest comparison of the control (N =35) vs. experimental (N = 49) group.
A graph showing no significant difference between the control and experimental groups at the pretest, and a significant difference between the control and experimental groups at the posttest.
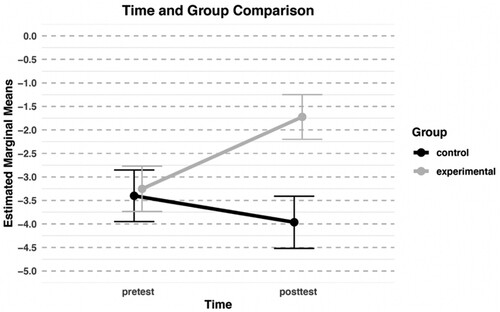
Table 4. Estimated marginal means.
Figure 3. Graphs showing English (mean score ca. 6.5k/10k) and Spanish vocabulary scores (mean score ca. 12/60).
Two graphs showing English (on the left) and Spanish (on the right) vocabulary sizes and posttest scores distribution.
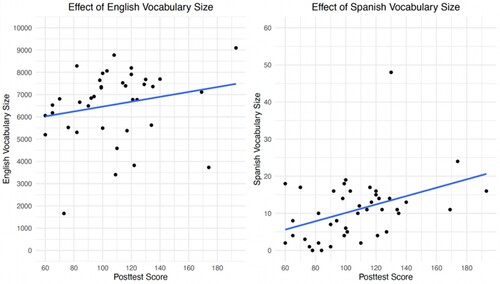
Figure 4. Comparison of learning single and MWUs.
A graph showing no significant difference between the single words and multiword units at the pretest, and a significant difference between the single words and the multiword units at the posttest.
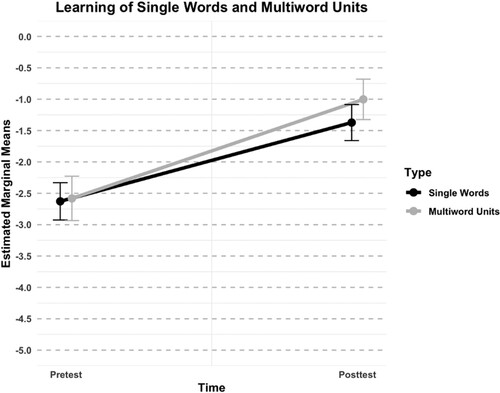
Table 5. Single words and MWUs estimated marginal means.