
Figures & data
Figure 1. Search term thread.
Notes: Search query thread (Military OR defence OR defense OR NATO OR army OR navy OR ‘air force’ or ‘armed forces’) AND (‘English Language’ OR ‘foreign language’ OR ‘second language’ OR L2) AND (Teaching OR Instruction OR Learning OR use OR testing).
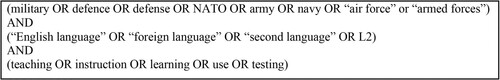
Figure 2. PRISMA flow chart illustrating the process of database search.
Flowchart of the scoping review process: Begins with 1778 records identified, narrows down to 1508 after removing duplicates, further reduced to 104 after screening for relevance, and concludes with 34 studies included for in-depth analysis.
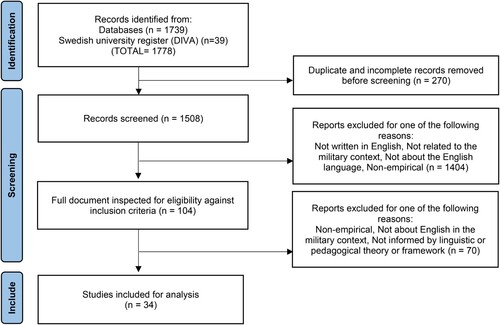
Table 1. Coding scheme.
Figure 3. Chronological frequency of publications.
Bar graph showing the number of articles published per year from 1993 to 2023. There is a visible increase in publications from 2010 onwards, peaking between 2018 and 2023 with up to five5 articles in some years.
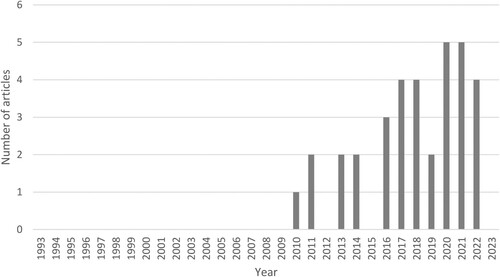
Figure 4. Number of participants per study.
Scatter plot graph showing the number of articles versus the number of participants. The horizontal axis represents the number of participants ranging from 0 to 600, and the vertical axis represents the number of articles from 0 to 7. Most data points are clustered at the lower end of participants, indicating a higher number of articles with fewer participants.
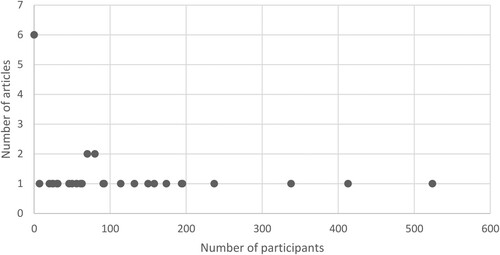
Table 2. Research approach.
Table 3. Branches of Service.
Table 4. Participants’ L1.
Table 5. Overview of researched topics.