Figures & data
Table 1. Head and neck cancer immunotherapy patient characteristics.
Figure 1. Methylation-derived cell type proportions from peripheral blood for selected samples over approximately 1 year of immunotherapy. Each point indicates the median proportion at each treatment time point. Vertical bars around the point indicate the minimum and maximum proportion at each time point. Methylation cytometry methods reveal the proportions for 12 immune cell types for patients exhibiting response to immunotherapy treatment over the course of 18 cycles. While several cell types do not appear to show substantial changes over time, memory CD8 T and NK populations exhibit a pronounced boost over the initial 100 days (the typical time-frame for which progression-free survival is considered ‘response’) with a near return to pre-treatment baseline levels at the 1 year mark.
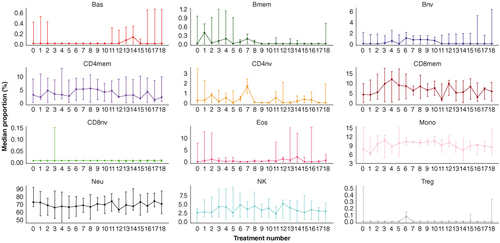
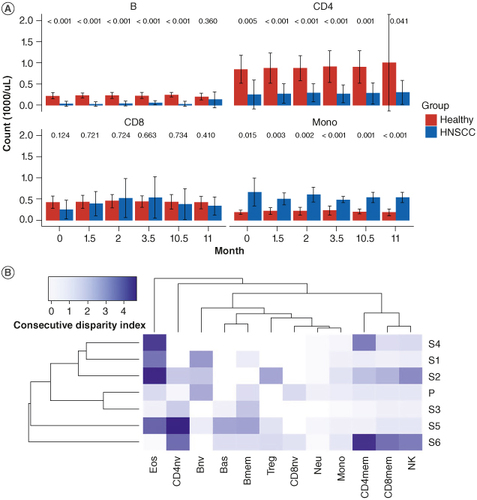
Figure 2. Immune composition of head and neck squamous cell carcinoma immunotherapy responders in comparison to healthy subjects. (A) Although limited by longitudinal data availability for healthy donors, mean counts (1000/ul) for B, total CD4 T, total CD8 T cells (both naïve and memory sub-types for each population) and monocytes, are shown for healthy and HNSCC immunotherapy responders at baseline, time period of initial immunotherapy treatment cycles (1.5, 2 and 3.5 months following initial treatment), and at around the 1-year mark (10.5 and 11 months post start of treatment). Error bars indicate one standard deviation above and below the mean. Red columns indicate mean counts for healthy controls; blue columns indicate mean counts for HNSCC immunotherapy responders. Distribution of each cell type proportion between healthy donors and HNSCC immunotherapy responders were compared with t-tests. P-value for each comparison is indicated above the bars at each timepoints. (B) Heatmap of adapted consecutive disparity index (aCDI) for each subject per cell type where ‘P’ is the healthy subject reference and ‘S1’- ‘S6’ are responders. Larger values of the aCDI are indicative of greater temporal variability of cell type proportions.