Figures & data
Figure 1. Air Quality Chamber: CLIMPAQ 50L and sniffing table.
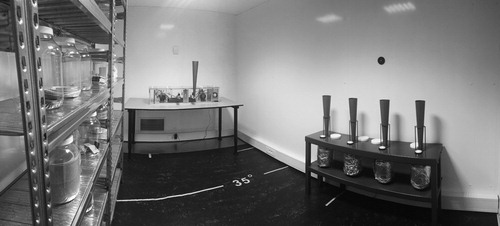
Figure 2. Diagram of the Experimental setup in the Air Quality Chamber. 1. Perfume; 2. Mint leaves; 3. Carpet, MDF (medium density fibreboard), or Vinyl (according to the schedule in ); 4. Crayons; 5. Carpet, MDF, or Vinyl (+plant, according to the schedule in ).
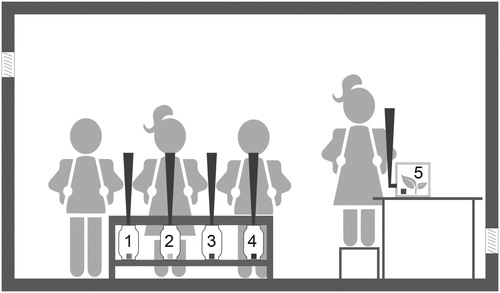
Figure 3. Selected materials + Spider plant inside of the CLIMPAQ 50L.
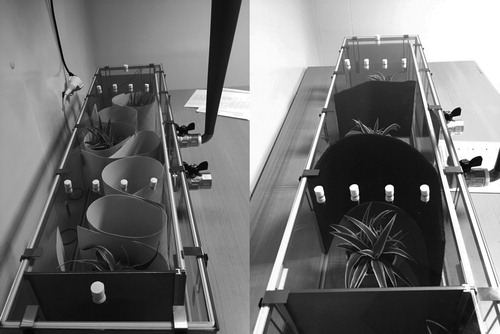
Table 1. Time schedule and selected sources of smell.
Figure 4. Part of the questionnaire for sniffing test.
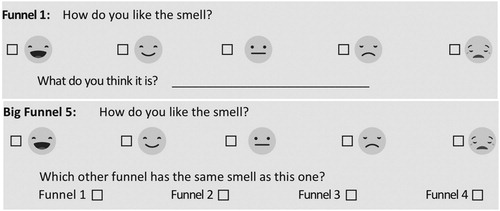
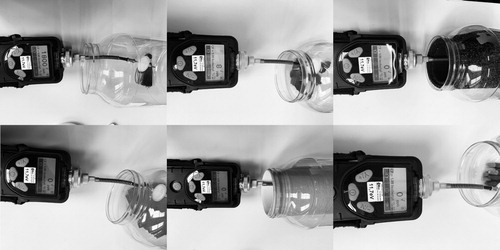
Figure 5. VOCs emitted by the selected materials: (a) perfume; (b) mint leaves; (c) carpet; (d) MDF; (e) vinyl; and (f) crayons.