
Figures & data
Figure 1. Measurement positions and schematic top-view layout of the mockup office room.
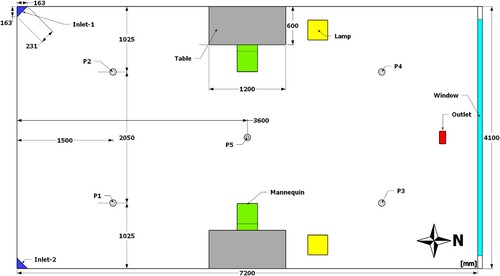
Figure 2. The office room showing the two CIJV inlets in the experimental validation setup.
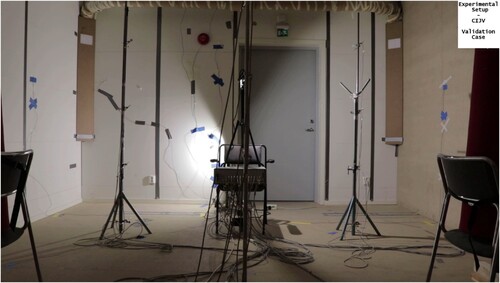
Figure 3. Evaluated areas around the mannequin at various heights.
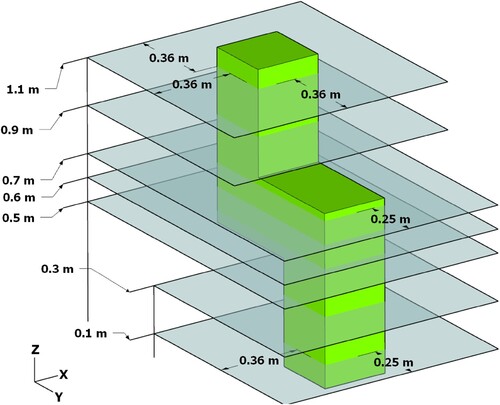
Figure 4. Isometric view over the mesh in the office room.
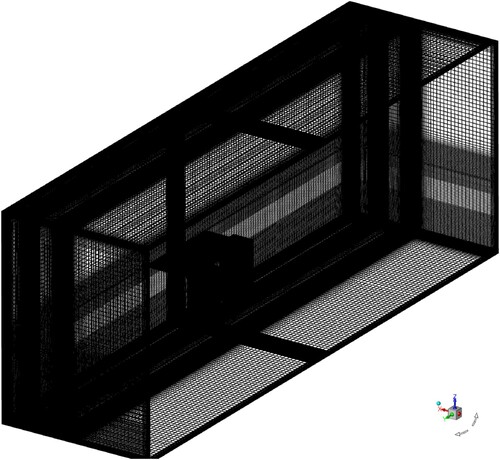
Figure 5. Mesh view in the x-direction directly below the inlet.
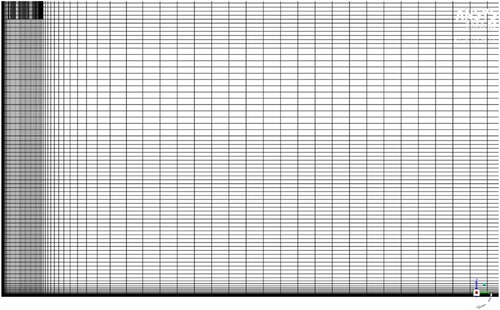
Figure 6. Mesh view in the y-direction directly below the inlet.
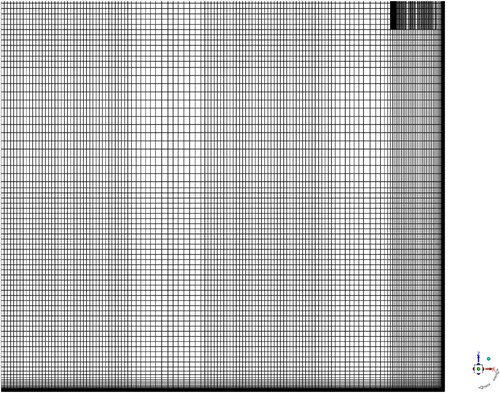
Figure 7. (a–j) Temperature and velocity profile comparisons for different turbulence models and experimental measurements at different locations (P1–P5).
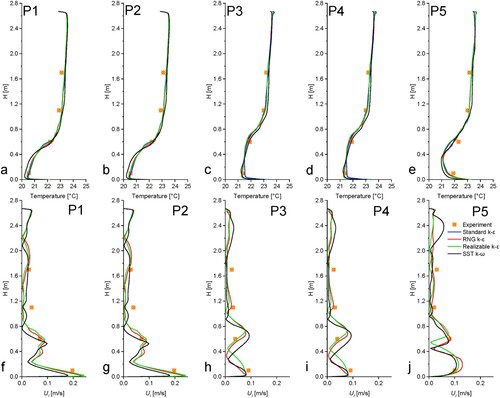
Table 1. ACE comparison between experimental and CFD at five locations.
Figure 8. Workspace locations evaluated at 3 positions L-1, L-2 and L-3.
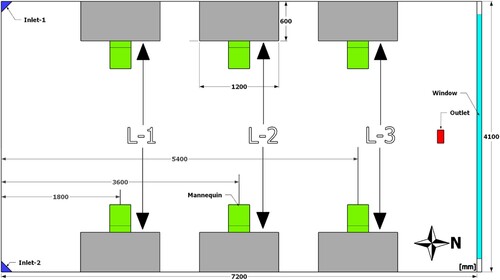
Table 2. Case conditions and parameter settings when evaluating the impact of different outdoor environment and supplied air temperature.
Figure 9. (a) Shows the horizontal averaged temperatures at different heights in the occupied zone (See ) for winter cases and (b) for summer cases.
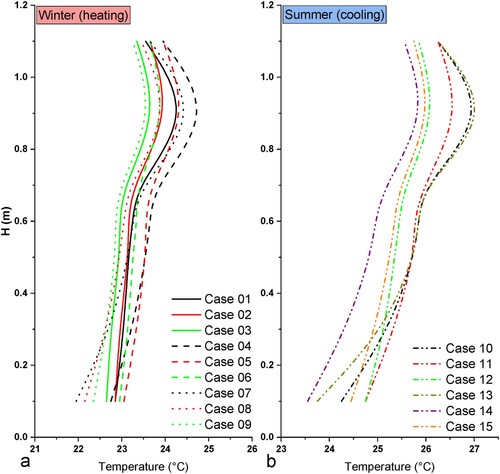
Figure 10. The temperature difference between the height of 1.1 and 0.1 m in the occupied zone for all cases.
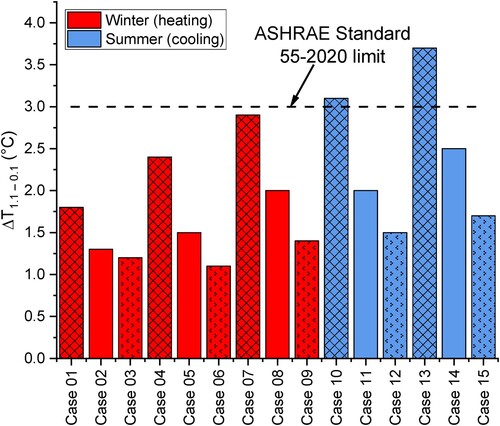
Figure 11. (a) Shows the horizontal averaged PMV level at different heights in the occupied zone (See ) for winter cases and (b) for summer cases.
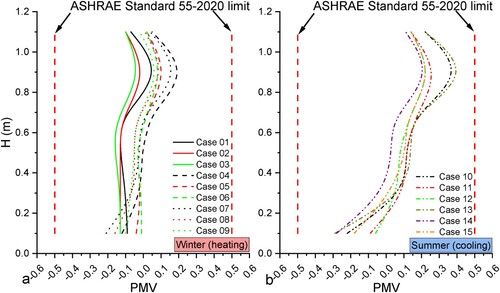
Figure 12. (a) Shows PPD level at different heights in the occupied zone for winter cases. (b) Shows PPD level at different heights in the occupied zone for summer cases.
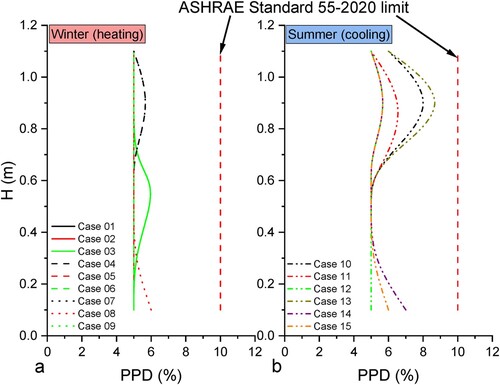
Figure 13. Shows the DR level at H = 0.1 m for all cases.
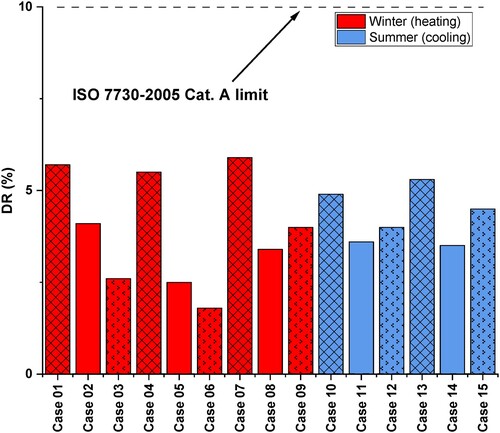
Figure 14. (a) Shows the horizontal averaged τ at different heights in the occupied zone for winter cases and (b) for summer cases.
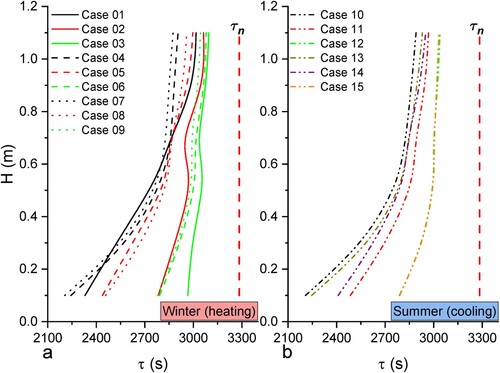
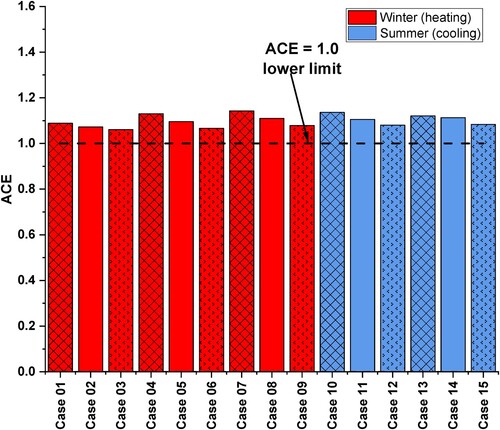
Figure 15. Shows the ACE at head level (H = 1.1 m) for all cases.
Data availability
Data will be made available on request by contacting the corresponding author.