Figures & data
Figure 1. Graph of the functions f1 and f2 in the case 0<a≤1/k.
Figure 2. Graph of the functions f1 and f2 in the case a>1/k.
Figure 3. Graph of the functions g1 and g2 in the case k>1.
Figure 4. Position of Ŷ3(k) for k∈(⅓, 1].
![Figure 4. Position of Ŷ3(k) for k∈(⅓, 1].](/cms/asset/a3227bd9-bd49-4af1-94d2-0ff69ef50a9b/tjbd_a_927596_f0004_b.gif)
Figure 5. Shape of Ω in the case k>1.
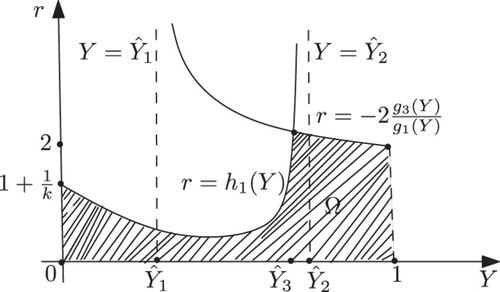
Figure 6. Graph of the functions g1 and g2 in the case 0<k≤1.
Figure 7. Shape of Ω in the case 0<k≤1.
Figure 8. Phase diagram when r=3.7, a=10, k=0.5, (x0, y0)=(0.3, 0.3) and n=25, 000.
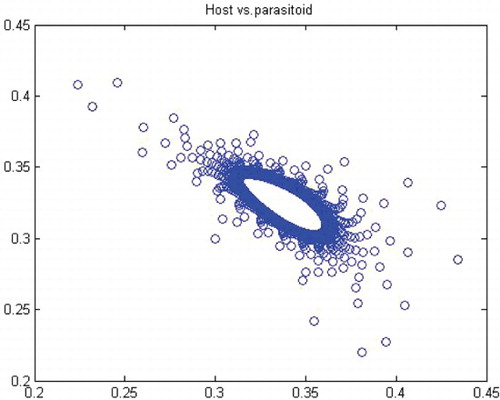
Figure 9. Phase diagram when r=3.6, a=10, k=0.5, (x0, y0)=(0.3, 0.3) and n=25, 000.
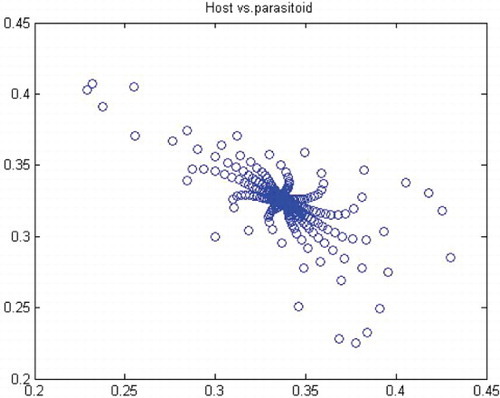
Figure 10. Phase diagram when r=1.6, a=27, k=2, (x0, y0)=(0.6, 0.6) and n=25, 000.
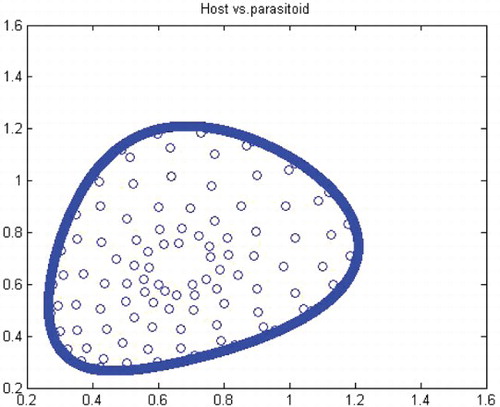
Figure 11. Phase diagram when r=1.49, a=27, k=2, (x0, y0)=(0.6, 0.6) and n=25, 000.
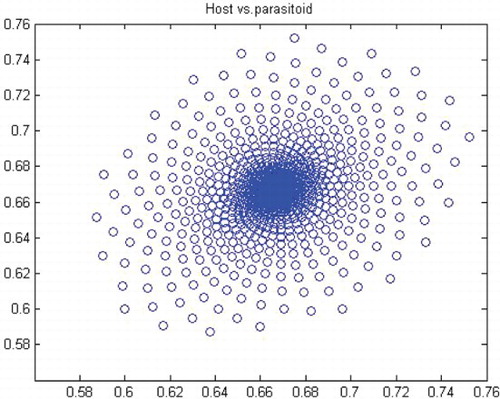
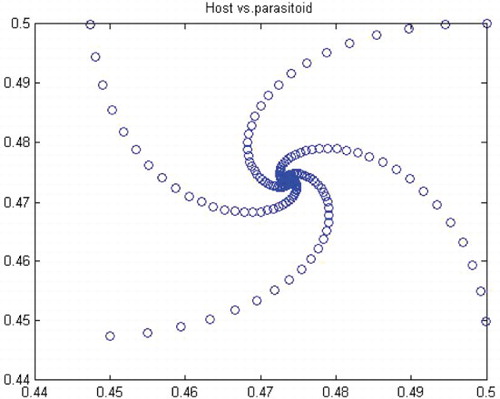
Figure 12. Phase diagram when r=2.2, a=50, k=0.9, (x0, y0)=(0.5, 0.5) and n=25, 000.
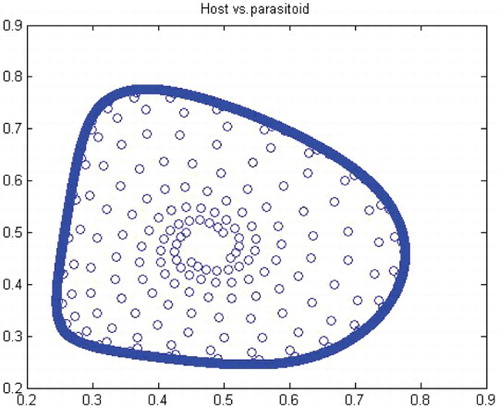
Figure 13. Phase diagram when r=2.0, a=50, k=0.9, (x0, y0)=(0.5, 0.5) and n=25, 000.