Figures & data
Figure 1. Comparison of performance capacity between three genotypes (Tbreadth) for different strengths of the performance-thermal breadth trade-off (a). The global optimum is fixed at the 50th column along the x-axis (xopt = 50) and local adaptation is not allowed (xadap = 0). The value of Tbreadth is indicated in the legend.
Figure 2. Overview of the life cycle of an individual.
Figure 3. The evolution of thermal breadth and dispersal in function of position along the x-axis before and during range shifting. The evolution of the thermal optimum is not allowed (xadap = 0). Each dot represents the genotype of a sampled individual. The global optimum of the population is located at the 50th column along the x-axis before range shifting and at the 1349th column during range shifting. a determines the strength of the performance-thermal breadth trade-off and is either fixed at 1, 5 or 10.
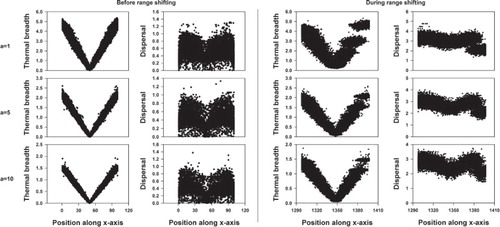
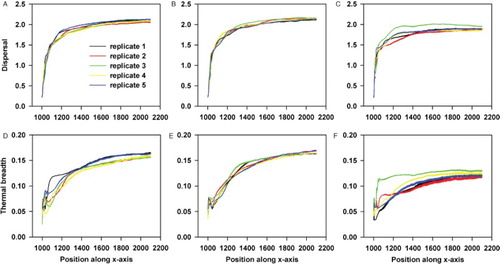
Figure 4. An overview of how the traits under selection change from the moment range shifting starts for the back (A,D), middle (B,E) and front (C,F) of the population. In this scenario, only dispersal and thermal breadth are evolvable. Each colour refers to the mean in either dispersal (A,B,C) or thermal breadth (D,E,F) for a particular replicate. In total, five replicates are used.
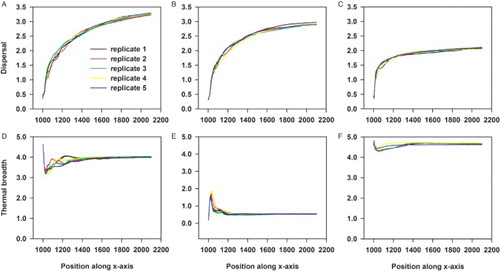
Figure 5. The relationship between dispersal and thermal breadth within a population experiencing range shifting. Here, local adaptation of the thermal optimum is not allowed (xadap = 0). Each dot represents the genotype of a sampled individual. a determines the strength of the performance-thermal breadth trade-off and is either fixed at 1, 5 or 10.
Figure 6. The evolution of thermal breadth and dispersal in function of position along the x-axis before and during range shifting when local adaptation of the thermal optimum is allowed. Each dot represents the genotype of a sampled individual. The global optimum of the population is located at the 50th column along the x-axis before range shifting and at the 1349th column during range shifting. a determines the strength of the performance-thermal breadth trade-off and is either fixed at 1, 5 or 10.
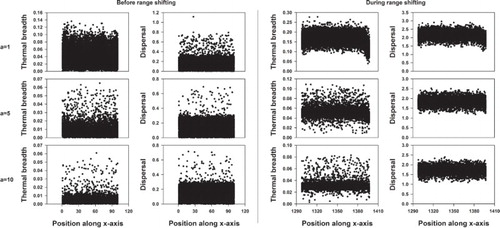
Figure 7. An overview of how the traits under selection change from the moment range shifting starts for the back (A,D), middle (B,E) and front (C,F) of the population. In this scenario dispersal, thermal optimum and thermal breadth are evolvable. Each colour refers to the mean in either dispersal (A,B,C) or thermal breadth (D,E,F) for a particular replicate. In total, five replicates are used.