1,918
Views
28
CrossRef citations to date
0
Altmetric
RESEARCH LETTER

Cucurbita pepo L. extracts as a versatile hydrotropic source for the synthesis of gold nanoparticles with different shapes

, , , , , , , , & show all
Pages 39-47 | Received 12 Dec 2014, Accepted 05 Mar 2015, Published online: 07 Apr 2015

Figures & data

Table 1. Metal concentration in metal-treated and untreated Cucurbita pepo plants.

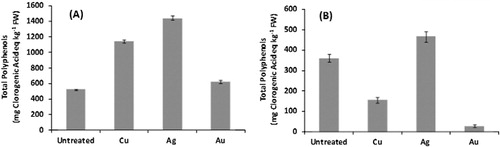
Figure 1. Mean concentrations (n = 3) of total polyphenols (mg chlorogenic acid eq. kg–1 d.w.) in shoots (A) and roots (B) of metal-treated and untreated Cucurbita pepo L. Error bars represent the ranges of the obtained values.
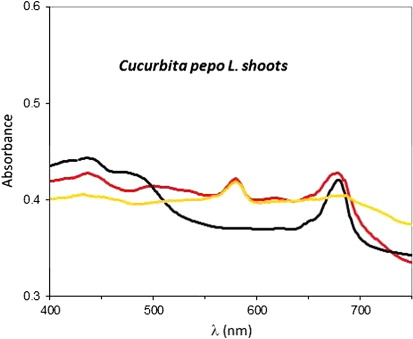
Figure 2. Absorption spectrum from shoot extract of untreated Cucurbita pepo L. recorded 2 h after reaction with HAuCl4 (red line) and with HCl (black line) in the same experimental conditions. The plasmon peak of AuNPs is located at ~570 nm. Its shape and position were unaltered 72 h after the synthesis (yellow line).
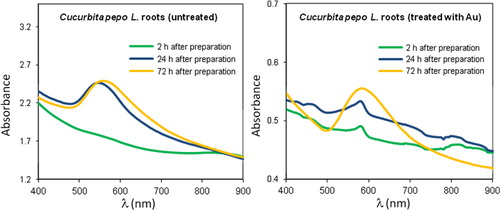
Figure 3. Absorption spectra of root extracts from Cucurbita pepo L. from roots of plants grown in the absence of metal ions (A) and in the presence of Au(III) 100 µ M (B), as described in the text.
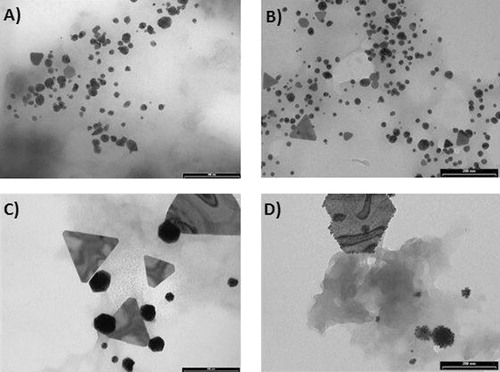
Figure 4. TEM images obtained from Cucurbita pepo L. root extracts of (A) untreated sample, (B) Ag-treated sample, (C) Au-treated sample, and (D) Cu-treated sample. All bars scale 20 nm.
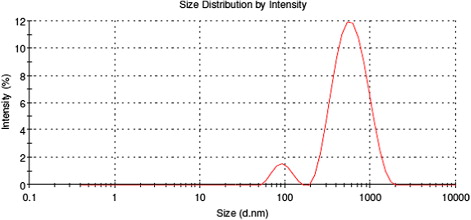
Figure 5. Size distribution obtained by DLS measurements. Peak 1 (7%) is centered at 93 nm and peak 2 (93%) is centered at 627 nm. Smaller particles do not contribute significantly to the scattered intensity.
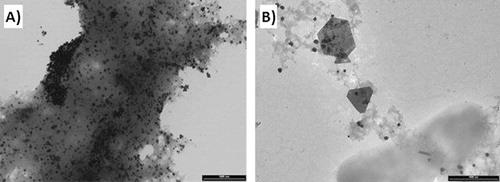
Figure 6. TEM image of a large area in the sample obtained from (A) shoot extract of Au-treated Cucurbita pepo L., evidencing the gel-like matrix which encapsulate AuNPs (bar scale 1000 nm) and (B) root extract of the same sample (bar scale 1000 nm).