Figures & data

Figure 1. SEM images of the prepared samples (a) Bi-BDC-80, (b) Bi-BDC-100, and (c) Bi-BDC-120.
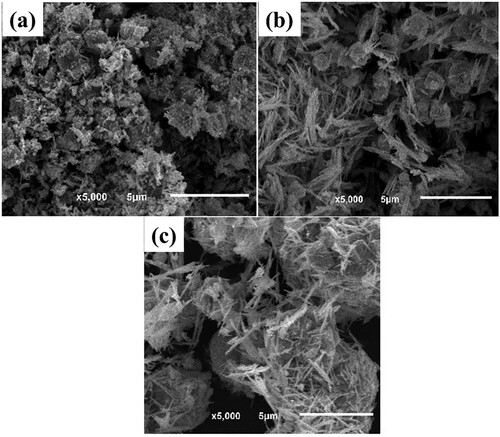
Figure 2. XRD patterns of the Bi-BDC frameworks were prepared at temperatures of 80, 100, and 120 oC.
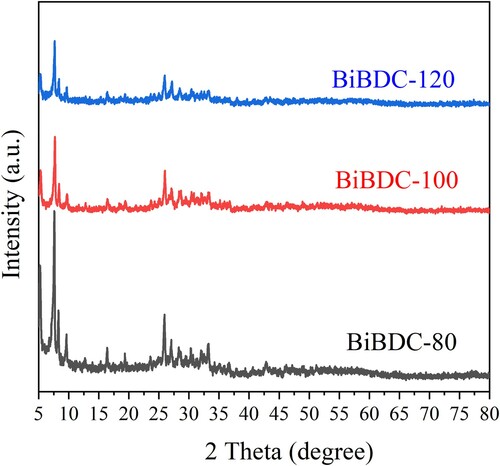
Figure 3. FT-IR spectra of the Bi-BDC frameworks prepared at temperatures of 80, 100 and 120 oC.
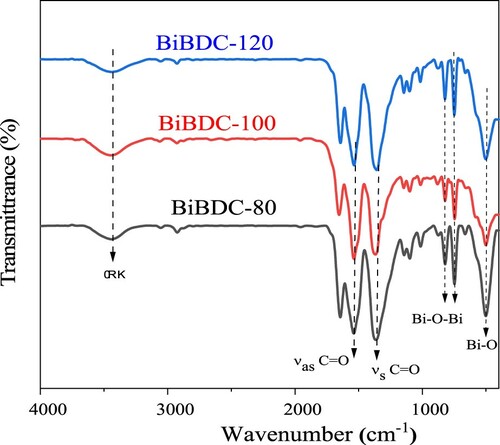
Figure 4. TGA analyses of the prepared Bi-BDC frameworks.
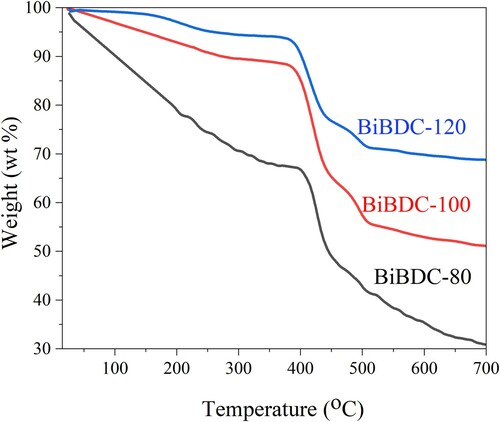
Figure 5. (a) UV-Vis diffuse reflectance spectroscopy and (b) Energy band spectra of the synthesized samples.
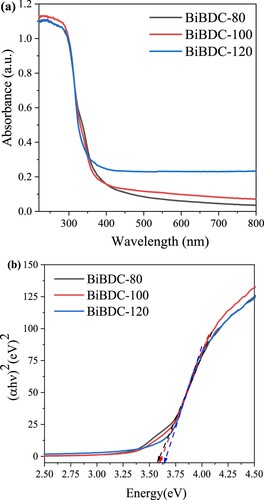
Figure 6. Absorption spectra of RhB solution under various irradiation time (catalyst dosage: 30 mg/L and 50 mL RhB concentration of 15 mg/mL).
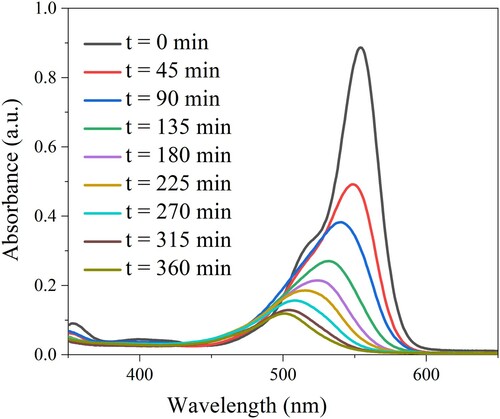
Figure 7. (a) Photodegradation profile of RhB under various irradiation time, and (b) photodegradation kinetics of pseudo-first-order (catalyst dosage: 30 mg/L and 50 mL RhB concentration of 15 mg/mL).
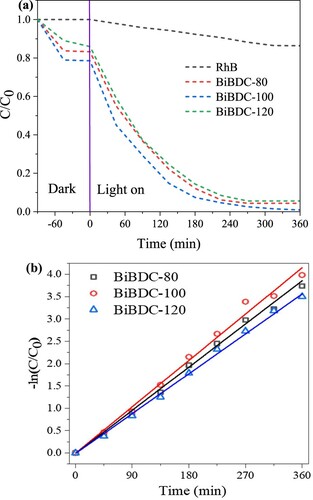
Figure 8. The proposed photodegradation mechanism of RhB dye over the prepared Bi-BDC under visible LED light irradiation.
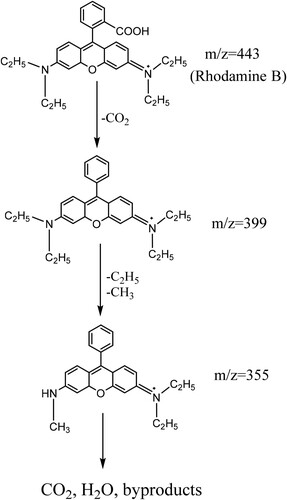
Table 1. The photodegradation of RhB dye over various materials.
Figure 9. Effects of experimental conditions on the removal of RhB over the Bi-BDC-100: (a) catalyst dosage (50 mL RhB concentration of 15 mg/mL), (b) initial RhB concentration (catalyst dosage: 30 mg and 50 mL RhB), and (c) pH media (catalyst dosage: 30 mg and 50 mL RhB concentration of 15 mg/mL).
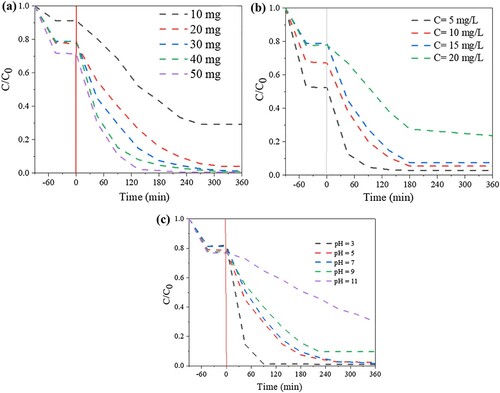
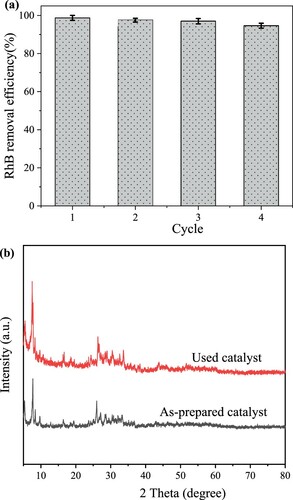
Figure 10. (a) The removal efficiencies of RhB after 4 cycles (catalyst dosage: 30 mg/L, 50 mL RhB concentration of 15 mg/mL and irradiation time of 360 min) and (b) XRD pattern of Bi-BDC-100 before and after photodegradation on RhB.