
Figures & data
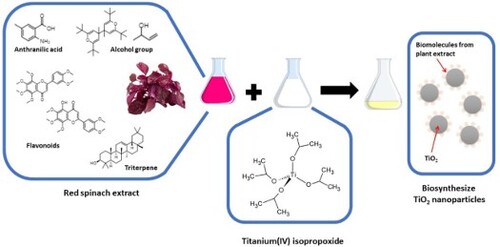
Figure 1. Total polyphenol content (TPC) for (a) various of time at temperature of 50°C and (b) various of temperature for 30 min.
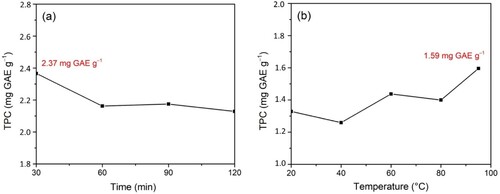
Table 1. Compounds detected in the red spinach leaf extract.
Figure 2. (a) XRD pattern, (b) UV-vis spectra, (c) FTIR spectra, and (d) TGA graph of TiO2 NPs.
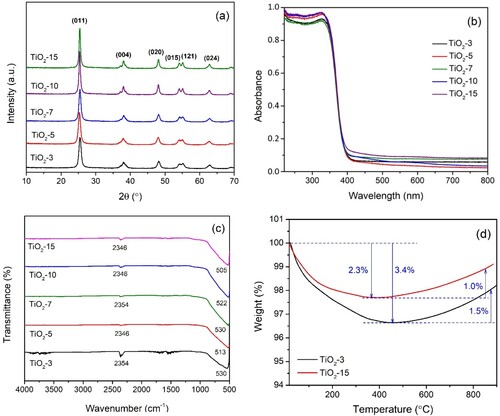
Table 2. Crystal properties of TiO2 NPs.
Figure 3. (a) SEM and (b) TEM image of TiO2-3.
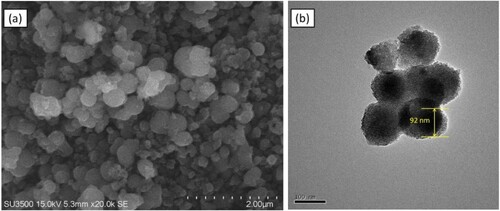
Figure 4. Particle size distribution of (a) TiO2-3, (b) TiO2-5, (c) TiO2-7, (d) TiO2-10, and (e) TiO2-15.
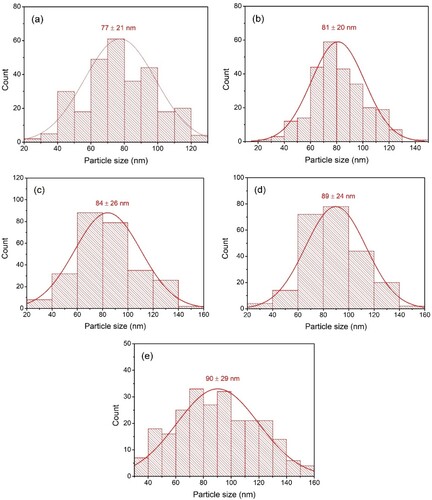
Figure 5. Mechanism of formation green synthesis TiO2 NPs with red spinach leaf extract.

Figure 6. (a) Photocatalytic activity, (b) kinetics value for all TiO2 NPs, and (c) photocatalytic activity of TiO2-3 on different pH for methylene blue degradation.
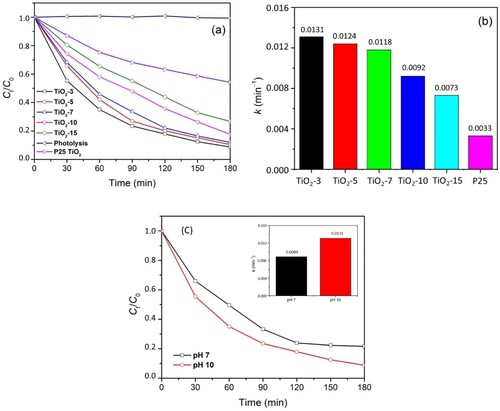
Table 3. Comparison of the photocatalytic activity with several previous reports of TiO2 synthesized using plant extracts.