Figures & data
Figure 1. Road map for the development of online tools. The white boxes denote our focus in the contextual phase as an input for the next research step or value specification phase. The gray box groups the other phases. Source: Adapted from the CeHRes Roadmap proposed by Gemert-Pijnen et al. (Citation2011, p. 9).
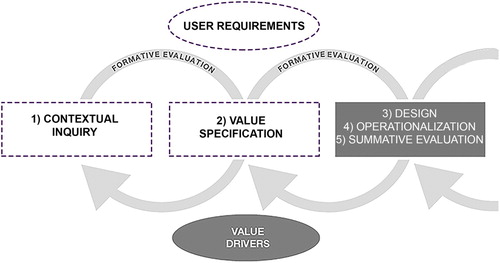
Figure 2. RiverCare program structure (Hulscher et al., Citation2016).
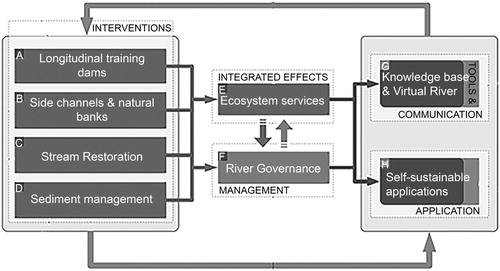
Figure 3. Schematic representation of the storyline used in the interviews. The scheme shows elements such as images, navigation buttons, options to like, comment or share and links to other resources. Source: The river illustration was adapted from the scheme about the PhD research of Kupilas (Citation2017) that was available online in the Reform Newsletter No 6 (Citation2015).
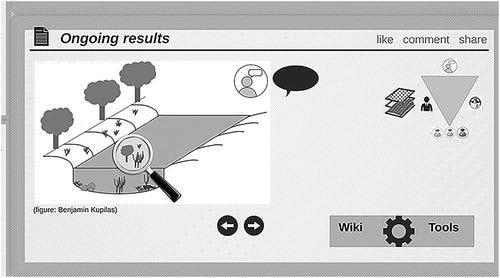
Table 1. Description of questions about the storyline introduction.
Table 2. Number of participants assigned to each category based on their scoring of the three questions addressing the storyline, its potential usefulness and their previous experience.
Table 3. Number of times that attributes were mentioned by interviewees from the various user groups. RE stands for researchers; US-AU stands for users working at government authorities or organizations; US-PR stands for practitioner users working at consultancies; US-SH stands for users affiliated to other stakeholder organizations.
Figure 4. A video to the storyline example that was discussed during the workshop is available in Appendix C as part of the supplementary material.
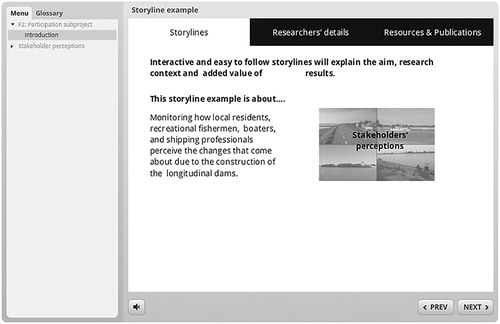
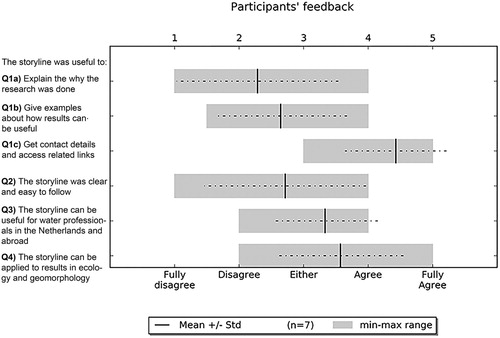
Figure 5. Participant’s feedback to the storyline example.