Figures & data
Figure 1. Number of days with valid data within a given month for daytime LST in the year 2005. The number of days has been obtained from the daily MOD11C1 product.
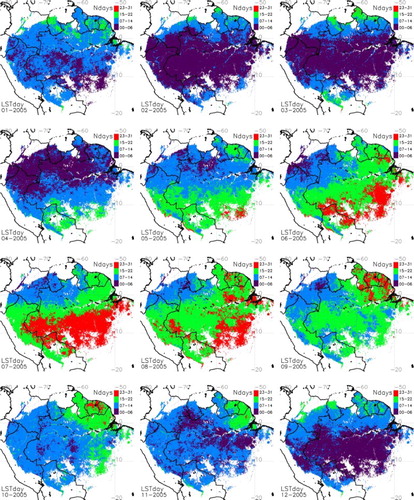
Figure 2. Same as , for nighttime LST.

Figure 3. Comparison between seasonal standardized anomalies obtained from MOD11C3 and MODrep products in the year 2010.
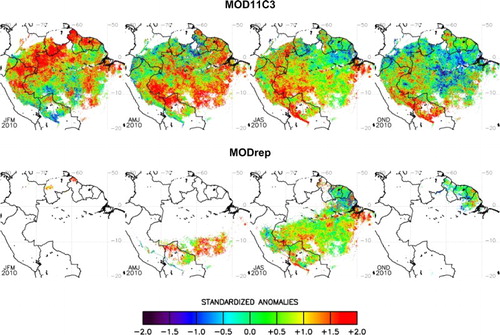
Figure 4. Differences between MOD11C3 and MODrep products for the months July, August, and September, and the period 2000–2014. Maps display bias, standard deviation (StDev), and coefficient of determination (R2).
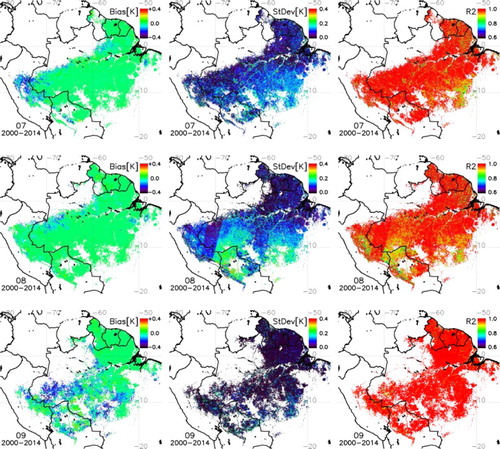
Figure 5. (a) Pixels removed from the monthly mean computation in the MODrep product after application of the 3s filter. (b) Hot spots (fires with a confidence level > 75%) included in the MOD14 product. (c) Number of valid days to compute the monthly mean in the MODrep product, and (d) number of valid days after removal of MOD14 hot spots. Results are presented for the monthly daytime LST in August 2005.
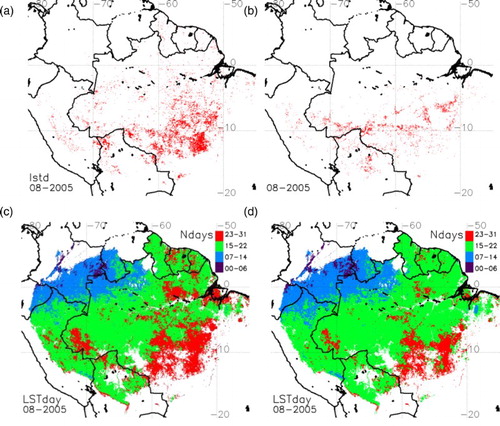
Figure 6. Standardized thermal anomalies obtained from MODIS MOD11C3 product for the JAS season and the period 2000–2014. MODIS images were resampled to 0.75°.
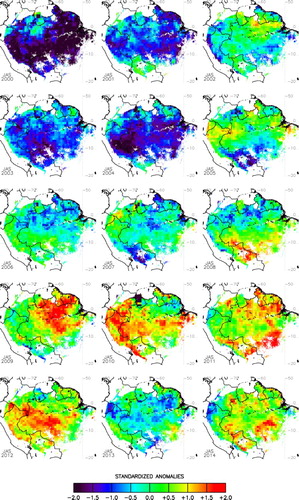
Figure 7. Standardized thermal anomalies obtained from the ERA-Interim skin temperature product (0.75°) for the JAS season and the period 2000–2014.
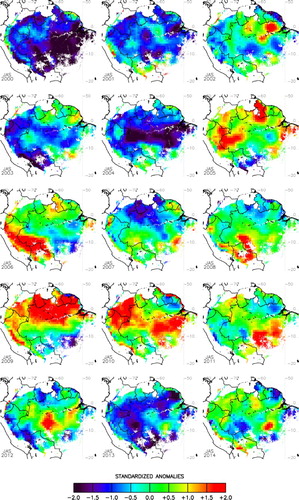
Figure 8. Differences in surface temperature anomalies between MOD11C3 and ERA-Interim products for different seasons and the period 2000–2014. Maps display bias, standard deviation (StDev), and coefficient of determination (R2).
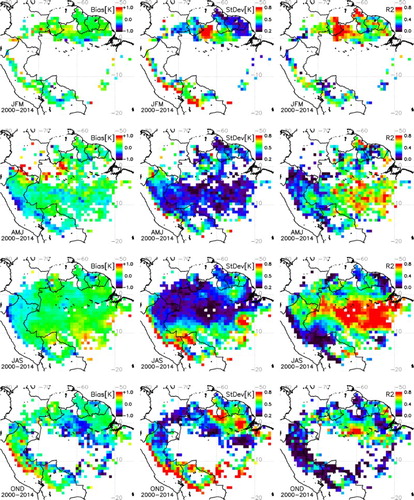
Figure 9. Time series of seasonal LST absolute anomalies since 2000 extracted from MOD11C3 and ERA-Interim products for two particular pixels: (i) one pixel located in southwestern Amazonia (left column; central coordinates of the pixel −10.25N, −70.25E), with a poor correlation between the two products, and (ii) one pixel located in eastern Amazonia (right column; central coordinates of the pixel −4.25N, −53E), with a high correlation between the two products.
Figure 10. Differences in (absolute) surface temperature between MOD11C3 and ERA-Interim products for different seasons and the period 2000–2014. Maps display bias, standard deviation (StDev), and coefficient of determination (R2).
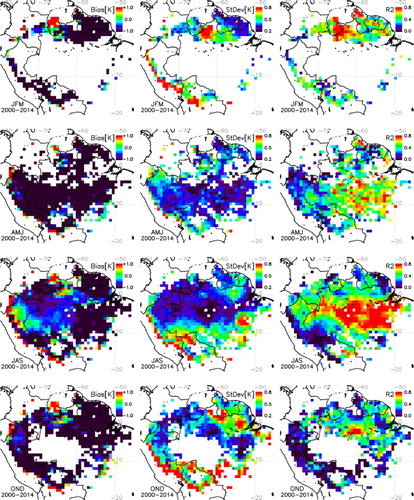
Figure 11. Trends in surface temperature anomalies for the JAS season during the period 2000–2014 using the different LST products. Only pixels with p < .05 are displayed.
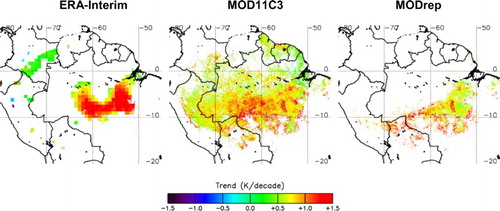
Figure 12. Scatter plots of trends in surface temperature anomalies (2000–2014) obtained from the MOD11C3 product versus (a) the ERA-Interim product and (b) the MODrep product. Bias and standard deviation are provided when all the data points are considered, as well as when only trend values significant at p < .05 are considered. Dashed lines represent the linear fit.
Figure 13. Intercomparison of trends in surface temperature anomalies (2000–2014) obtained from ERA-Interim and MOD11C3 products over different longitudinal transects. Values marked with an asterisk indicate statistical significance at p < .05.